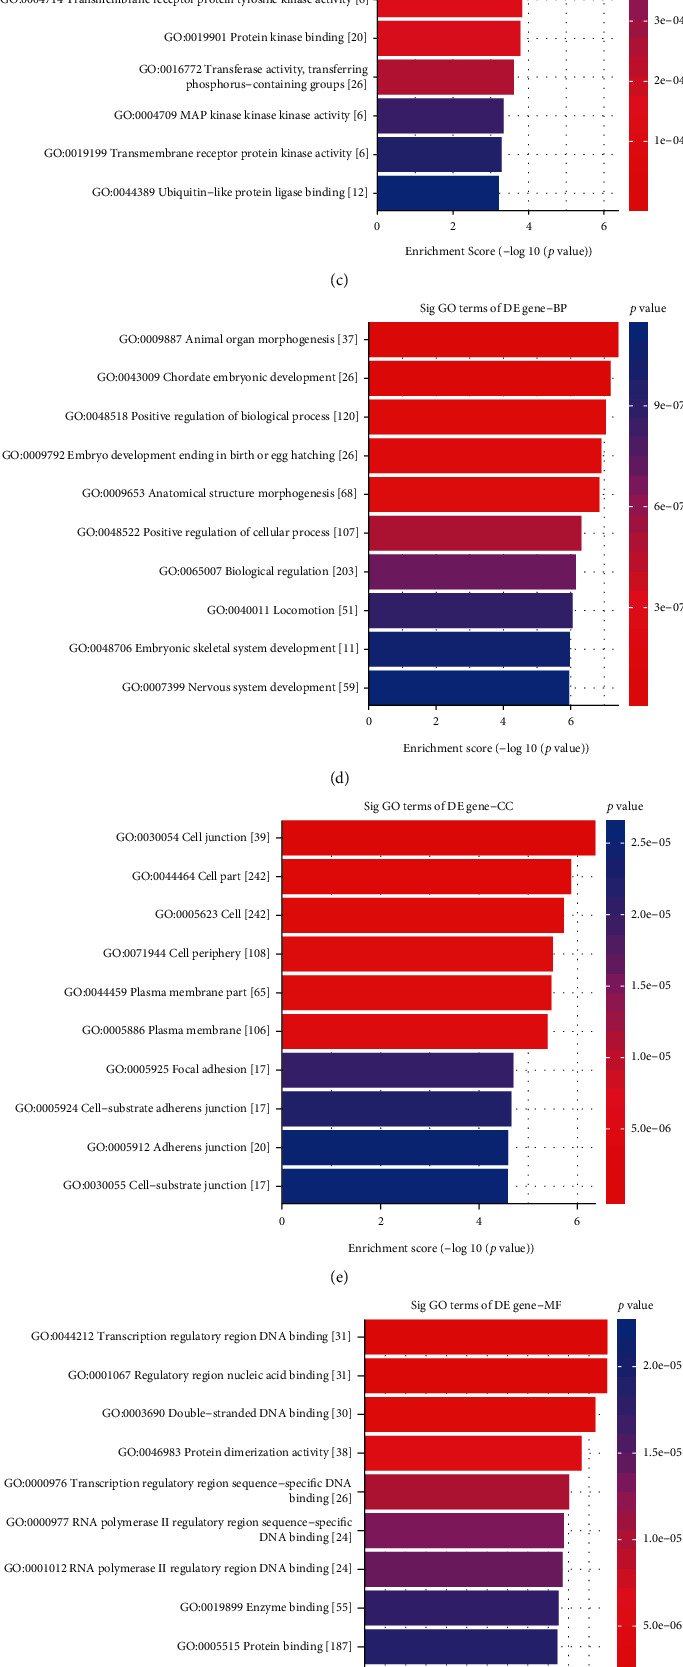
Figure 6.

GO and KEGG enrichment analysis of differentially methylated genes. The top ten GO enrichment analysis results for hypermethylated genes including biological process (a), cellular component (b), and molecular function (c). The top ten GO-biological process (d), cellular component (e), and molecular function (f) results for hypomethylated genes. (g, h) The top ten KEGG pathway enrichment analysis results for hyper- and hypomethylated genes.
