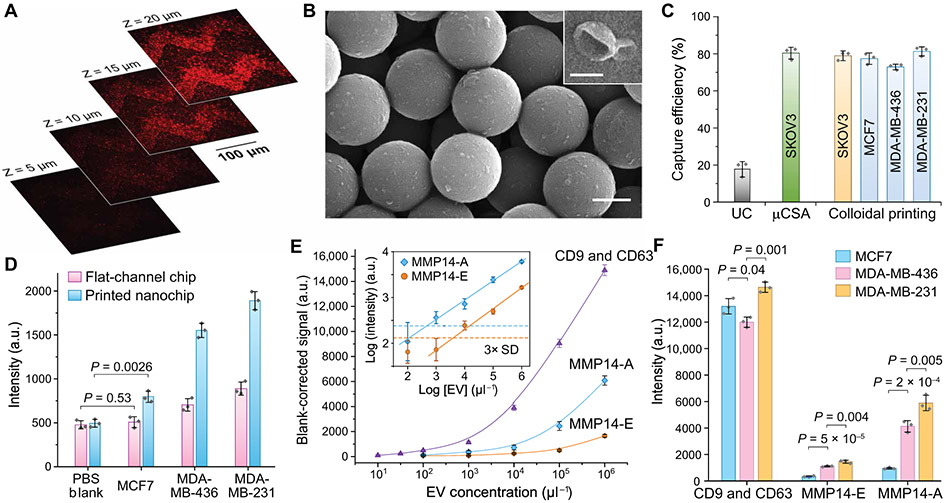
Fig. 2. Characterization of the EV-CLUE chip for immunoisolation and integrative molecular and activity phenotyping of sEVs.
(A) 2D confocal images at variable depth and (B) representative SEM images of colon cancer COLO1 cell–derived sEVs captured on and inside the self-assembled nanoporous silica micropatterns printed on the substrate. Dil dye-stained COLO1 EVs (106 μl−1) were assayed for confocal fluorescence microscopy. Scale bars, 500 nm (B) and 100 nm (B, inset). (C) Comparison of sEV capture efficiency for standard UC and the nanochips fabricated by the μCSA and colloidal inkjet printing methods. Fluorescently stained EVs of cancer cell lines were spiked in healthy human plasma at 106 μl−1. (D) Comparison of the flat-channel and nanopatterned chips for specific detection of MMP14 in UC-purified vesicles (106 μl−1) from breast cancer cell lines. Two-tailed Student’s t test was used for two-sample comparison, P < 0.05. (E) Calibration of the EV-CLUE chip by measuring the total sEV concentration (determined by CD9 and CD63), MMP14 expression (MMP14-E), and MMP14 proteolytic activity (MMP14-A) of MDA-MB-231 EVs. Inset: Determination of LODs for the MMP14 activity assay from 3 SDs of the backgrounds (dashed lines). (F) Integrative multiparameter analysis of purified EVs (106 μl−1) from three breast cancer cell lines with different invasiveness. Statistical difference was determined by one-way ANOVA with post hoc Tukey’s pairwise multiple comparisons test, P < 0.05. Anti-CD81 capture mAb was used in all cases. All data were presented as mean values with error bars of 1 SD (n = 3).

