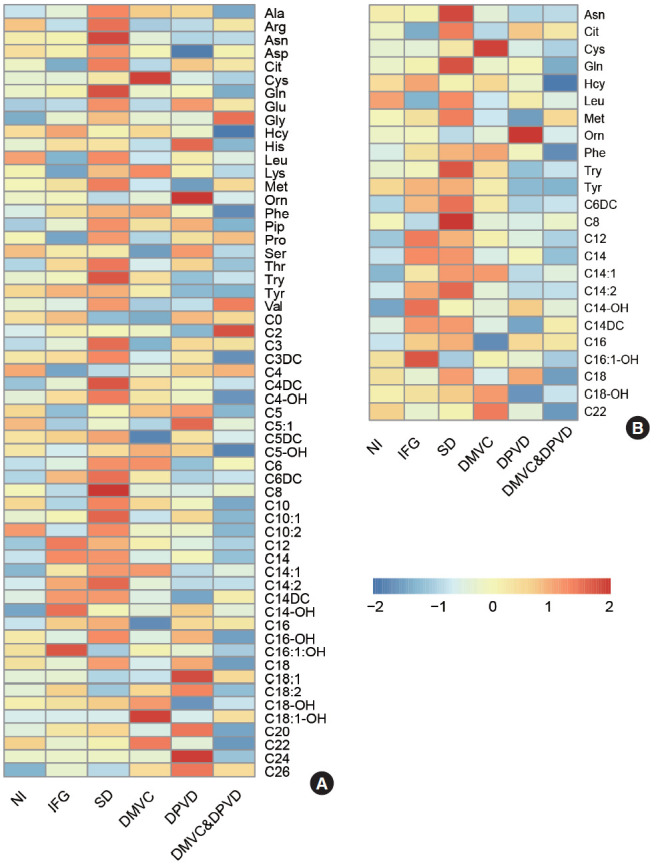
Fig. 2.

Differential metabolites were determined by six comparisons. (A) The heatmap represented the levels of all 58 metabolites in six groups and (B) the heatmap represented the level of 24 differential metabolites in six groups. NI, normal individual; IFG, impaired fasting glucose; SD, simple diabetes; DMVC, diabetic microvascular complication; DPVD, diabetic peripheral vascular disease.
