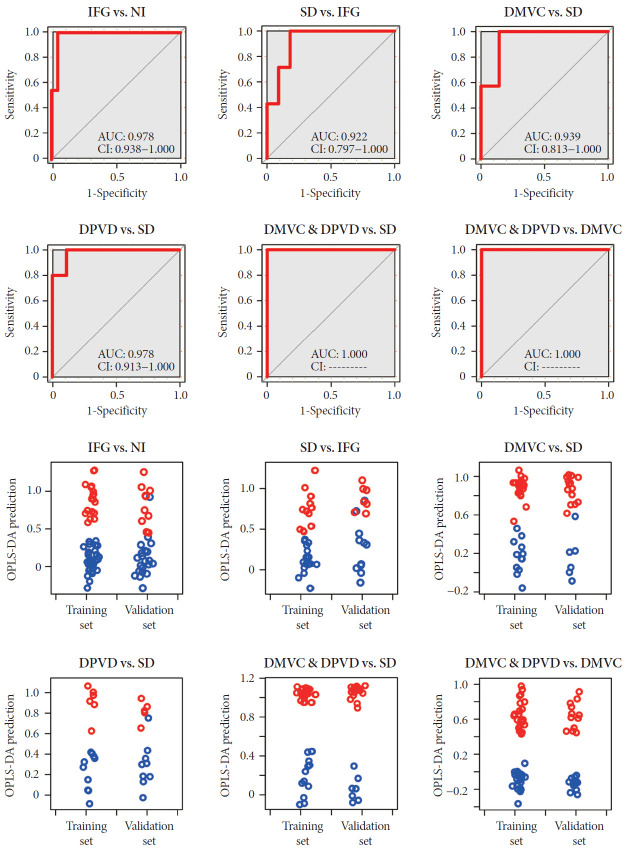
Fig. 4.
The receiver operating characteristic (ROC) curves and prediction plots using the model were established by the six biomarker panels. These plots were plotted to represent the sensitivity, specify and predictive capacity of the partial least square (PLS) regression models established by each biomarker panel. In the ROC curves, the area under curve (AUC) and confidence interval (CI) were also given in the plots. In the prediction plots, individuals from control group and case group were also represented by different colors (blue and red). IFG, impaired fasting glucose; NI, normal individual; SD, simple diabetes; DMVC, diabetic microvascular complication; DPVD, diabetic peripheral vascular disease.

