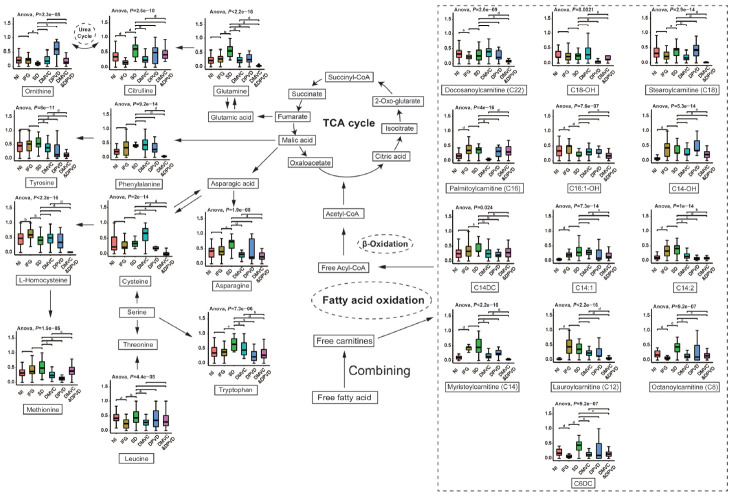
Fig. 5.
The metabolic pathways of differential biomarkers from six comparison were plotted based on Kyoto Encyclopedia of Genes and Genomes (KEGG) database. In this plot, differential metabolites selected form six comparisons were mapped into several pathways, including tricarboxylic acid (TCA) cycle, urea cycle, fatty acid oxidation and etc. The levels of differential metabolites from six groups were represented in boxplot. Analysis of variance (ANOVA) was carried out to determine the significance of each differential metabolite among six groups. NI, normal individual; IFG, impaired fasting glucose; SD, simple diabetes; DMVC, diabetic microvascular complication; DPVD, diabetic peripheral vascular disease. aP<0.05, bP<0.01, cP<0.001, dP<0.0001.

