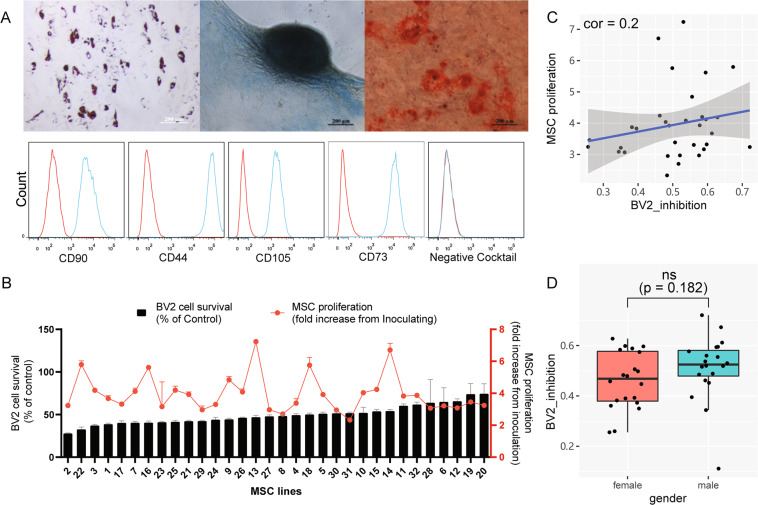
Fig. 1. Donor-dependent variations of huMSC proliferation and immune modulation.
A Three lineage differentiation of huMSCs and expression of cell surface markers. Upper Panel from left to right: MSCs differentiated to adipocytes, chondrocytes, and osteocytes. B BV2-suppression capacity and proliferation capacity of 32 lines of huMSCs. The black bars represent the ratio of BV2 cell mass after 48 h cultured in MSC-CM compared to RPMI-1640 (control medium). The red dots represent the ratio of total huMSC mass at 72 h after inoculation compared to 1 h after inoculation. C correlation between BV2-suppression capacity and huMSC proliferation capacity of 32 huMSC lines. D Boxplot shows BV2-suppression capacity between male (n = 20) and female (n = 20) huMSC lines, eight extra huMSC lines were added to increase the statistical power.

