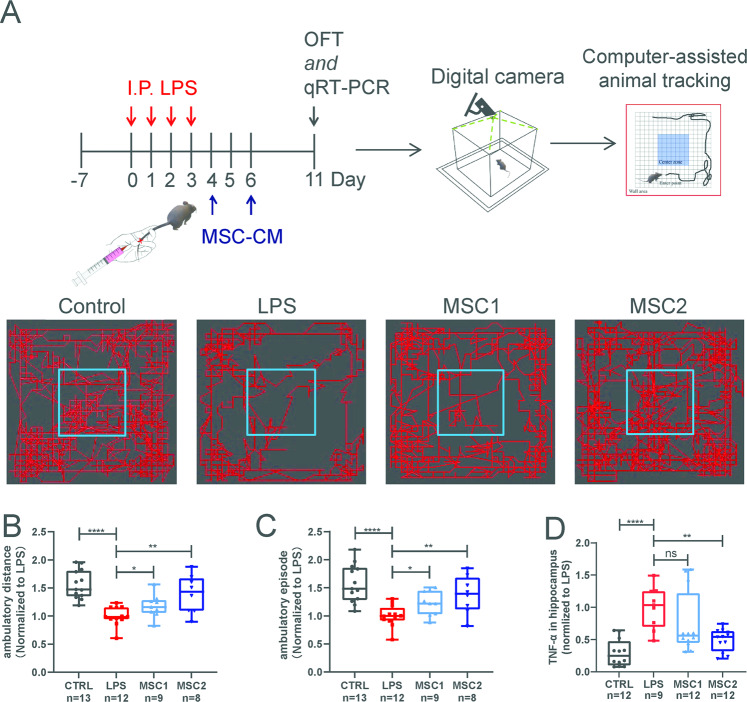
Fig. 2. Donor-dependent variations in immune modulation of huMSCs in LPS-induced neural inflammation animal model in vivo.
A Schematic diagram shows in vivo assessment MSC-CM treatment efficacies in LPS-induced neuroinflammation animal model. Open-field-test was used as the main behavioral readout. Boxplots show ambulatory distance (B) and episodes (C) of the open-field-test of each treatment groups. All data were normalized to the average value of the LPS group. D Boxplot shows inflammatory factors TNF-α mRNA levels in hippocampus of each group. Data were also normalized to the average value of the LPS group, and presented as mean ± SEM, *P < 0.05, **P < 0.01, ****P < 0.0001.

