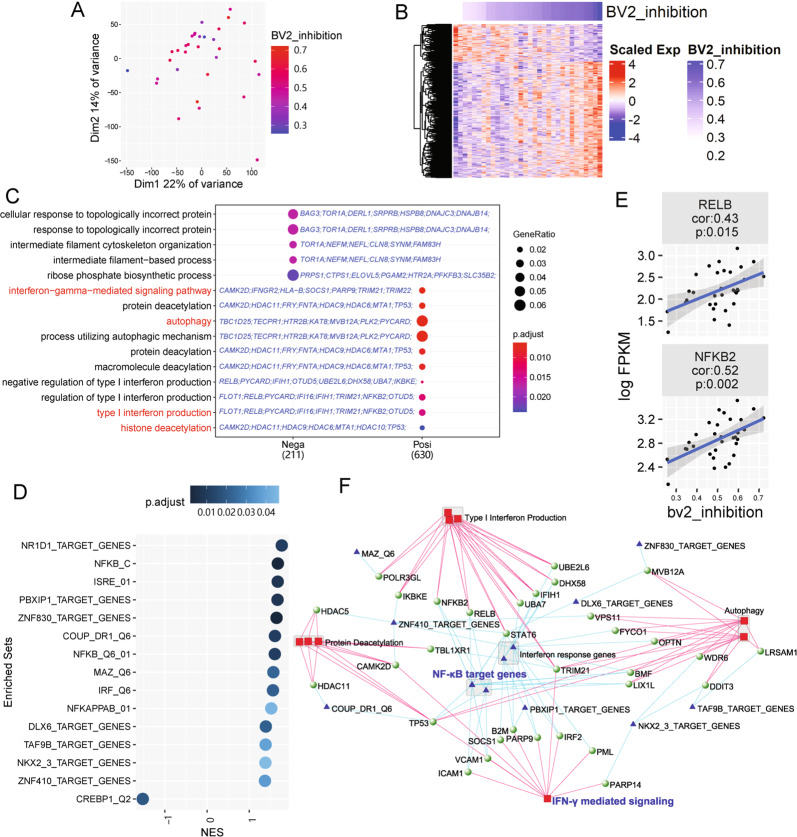
Fig. 3. Transcriptomic analysis of 32 lines of huMSCs revealed functional modules related to BV2-suppression capacity.
A PCA of 32 huMSC lines. B Heatmap shows expression and clustering of genes, expression of which significantly correlated to BV2 inhibition capacity of 32 lines of huMSCs. C GO enrichment analysis of BV2 inhibition correlated genes. IFN-γ, autophagy, and related terms are highlighted in red, which are positively correlated with BV2 inhibition. Candidate genes belonging to each GO term are shown in blue. D GSEA analysis of enriched TFBS targeting gene sets, most of which, except for one, were positively correlated with BV2 inhibition (normalized enrichment score (NES) > 0). E Correlation between gene expression levels of two subunits of NF-κB complex and BV2 inhibition capacity. F Network shows connection between enriched GO terms, TFBS targeting gene sets, and positively correlated genes. Red squares represent GO terms and blue triangles represent TFBS targeting gene sets. The nodes of green balls are genes, which belonging to both corresponding GO terms and TFBS targeting gene sets.

