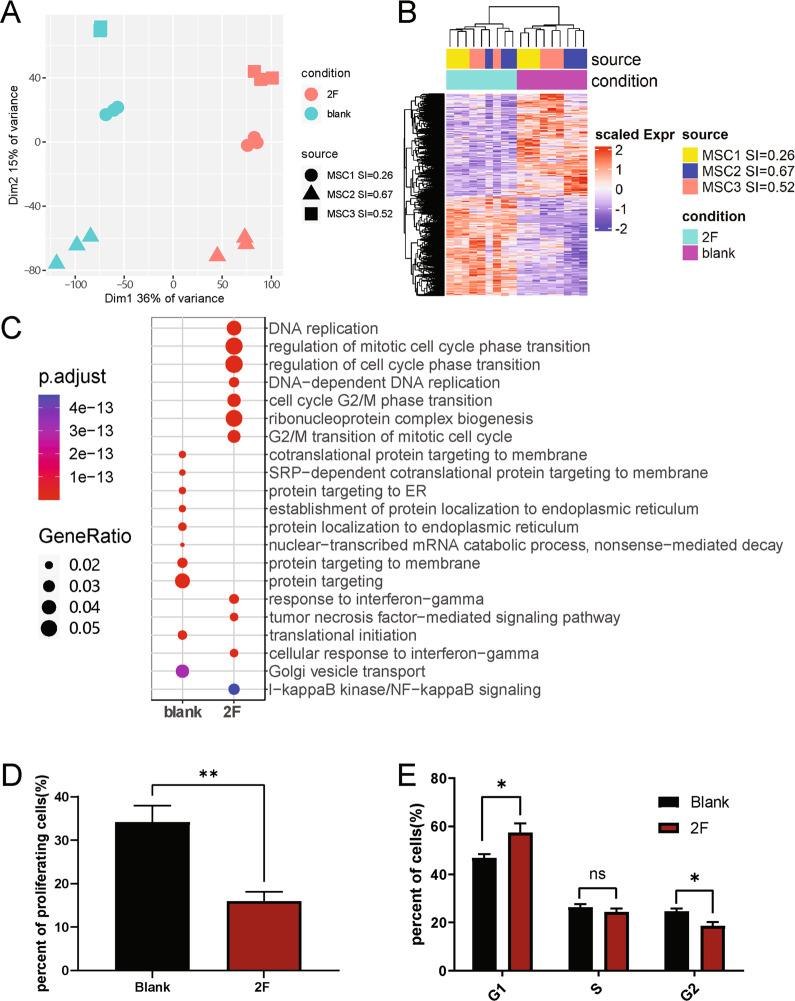
Fig. 5. Transcriptome analysis of huMSCs before and after 2-factor treatment.
A PCA of all samples including 3 different genetic background and 2 conditions. B Heatmap demonstrating differentially expressed genes (DEGs) between 2 conditions. C GO enrichment analysis of DEGs in B. D Bar-plot demonstrating percentage of proliferating cells before and after 2-factor stimulation based on EdU assay. E Bar-plot shows percentage of cells in each cycle phase before and after cytokine stimulation based on flow cytometry.

