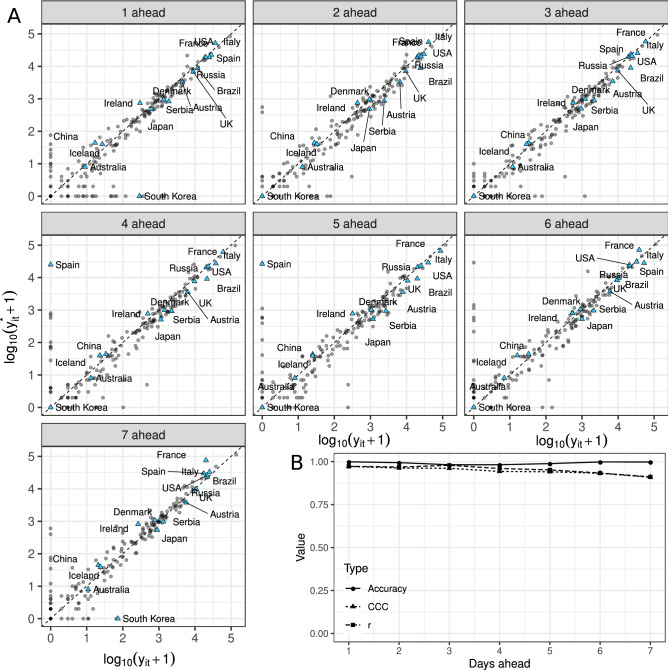
Figure 1.
(A) Logarithm of the observed versus the forecasted daily number of cases for each country, for up to seven days ahead, where each day ahead constitutes one panel. The forecasts were obtained from the autoregressive state-space hierarchical negative binomial model, fitted using data up to 18-November-2020. The first day ahead corresponds to 19-November-2020, and the seventh to 25-November-2020. Each dot represents a country, and the sixteen countries shown in Fig. 2 are represented by blue triangles. We add 1 to the values before taking the logarithm. (B) Observed accuracy, concordance correlation coefficient (CCC) and Pearson correlation (r) between observed () and forecasted () values for each of the days ahead of 18-November-2020.

