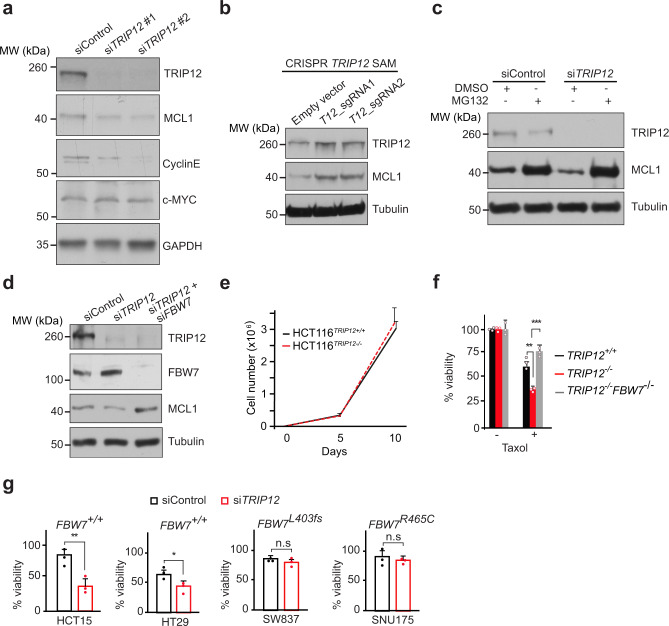
Fig. 3. TRIP12 regulates chemotherapy resistance via MCL1 and FBW7.
a Western blots showing levels of the indicated FBW7 substrates in HEK293T cells treated with a control siRNA or two independent siRNAs targeting TRIP12. b Western blots for TRIP12 and MCL1 in cells targeted with CRISPR/Cas9 SAM TRIP12 sgRNAs or an empty vector control. Tubulin used as a loading control. c Western blots for MCL1 from HEK293T cells treated with control and TRIP12 siRNA ± MG132. Tubulin used as a loading control. d Western blot for the indicated proteins in HEK293T cells treated with the indicated siRNAs. Blots in a–d are representative of at least three independent experiments. e Cell proliferation of HCT116 cells of indicated genotypes, as judged by cell counting on indicated days. Graph shows mean ± SD of three independent experiments. f Viability of HCT116 cells of the indicated genotypes as judged by CellTiter-Blue® viability assay in the presence or absence of 100 nM Taxol and shown as % viability relative to the untreated control. Bar graphs represent Mean ± SD of three independent experiments, **p = 0.004 and ***p = 0.0001. g Viability of colorectal cancer cell lines with the indicated genotypes, treated with 100 nM Taxol for 72 h as judged by CellTiter-Blue® assay and shown as % viability relative to the control. Bar graphs represent mean ± SD of three independent experiments, **p = 0.01 and *p = 0.04, n.s., not significant. p-values calculated by two-tailed type two Student’s t-test. See also Supplementary Fig. 3. Source data are provided as a Source Data file.

