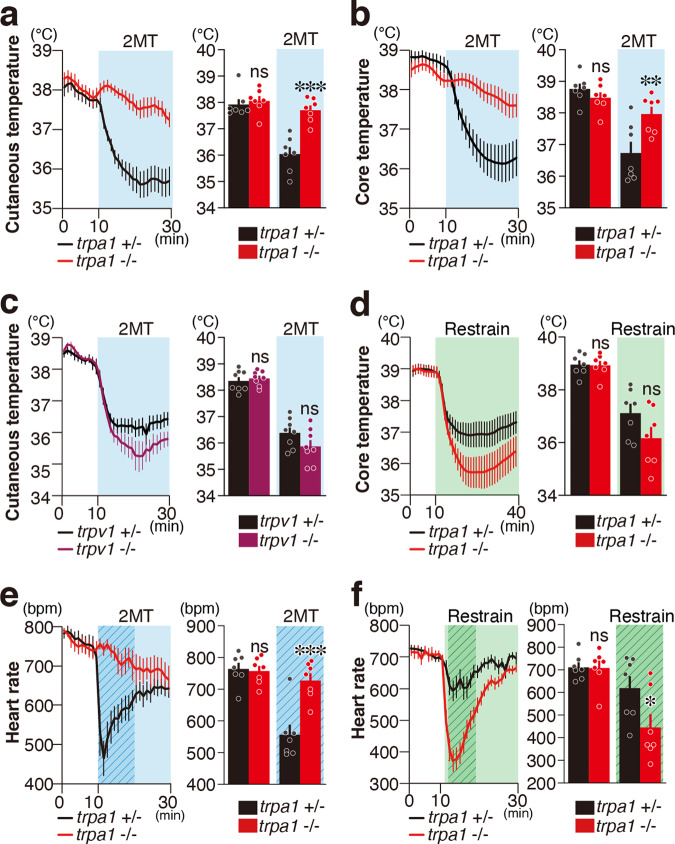
Fig. 1. Trpa1 mediates tFO-evoked hypothermia and bradycardia.
a, b Cutaneous temperature (a) and core body temperature (b) temporal analysis in Trpa1−/− (red) and control (black) mice in response to presentation of 2-methyl-2-thiazoline (2MT) (a, n = 7 for each genotype; b, n = 7 for each genotype). Mean cutaneous/core temperature in 10 min of baseline session and 20 min of 2MT presentation are also shown (a, p = 0.8708 for baseline session and p < 0.0001 for during 2MT presentation; b, p = 0.6638 for baseline session and p = 0.0026 for 2MT session). c Cutaneous temperature temporal analysis in Trpv1−/− (purple) and control (black) mice in response to 2MT presentation (n = 8 for each genotype). Mean cutaneous temperature in 10 min of baseline session and 20 min of 2MT presentation are also shown (p = 0.9121 for baseline session and p = 0.0935 for 2MT session). d Core body temperature temporal analysis in Trpa1−/− (red) and control (black) mice in response to the restrained condition (n = 7 for each genotype). Mean core temperature during baseline session (1–10 min, p = 0.9981) and during restrained condition (12–40 min, p = 0.0631) are also shown. e, f Temporal analysis of heart rates in Trpa1−/− (red) and control (black) mice in response to 2MT presentation (e, n = 7 for each) and in restrained condition (f, n = 7 for each). Mean heart rate in response to 2MT presentation [e, p = 0.9757 for baseline session (1–10 min) and p < 0.0001 for 2MT session (11–20 min, marked by shaded duration in the left figure)] and the restrained condition [f, p = 0.9987 for baseline (1–10 min) and p = 0.01084 for restrained condition (12–20 min, marked by shaded areas in the left figure)] are also shown. Data are shown as mean ± SEM. Two-way ANOVA followed by Sidak’s multiple comparison test was used to assess significance; *p < 0.05; **p < 0.01; ***p < 0.001; ns p > 0.05.

