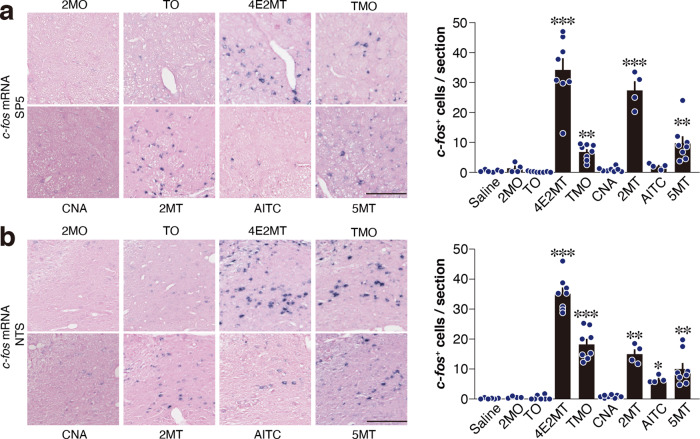
Fig. 8. Sp5/NTS activation by various compounds.
a, b Representative images of in situ hybridization of c-fos mRNA (left) and quantification of c-fos-positive cells (right) in the Sp5 (a) and NTS (b) in response to IP injection of the indicated compounds (n = 6 for saline, n = 4 for 2MO, 2MT, and AITC, and n = 8 for TO, 4E2MT, TMO, CNA, and 5MT; a, p = 0.5447 for 2MO, p = 0.5745 for TO, p < 0.0001 for 4E2MT, p = 0.0071 for TMO, p = 0.4904 for CNA, p = 0.0005 for 2MT, p = 0.2331 for AITC, and p = 0.0028 for 5MT; b, p = 0.5148 for 2MO, p = 0.9379 for TO, p < 0.0001 for 4E2MT, p = 0.0001 for TMO, p = 0.2798 for CNA, p = 0.0034 for 2MT, p = 0.0447 for AITC, and p = 0.0043 for 5MT). Scale bar, 100 μm. Data are shown as mean ± SEM. Kruskal–Wallis with uncorrected Dunn’s test was used to assess significance; *p < 0.05; **p < 0.01; ***p < 0.001.

