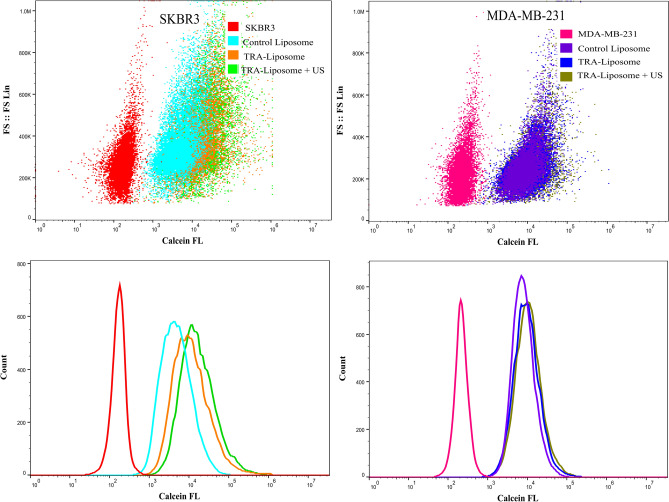
Figure 3.
Flow cytometry analysis of calcein uptake by SKBR3 and MDA-MB-231 cells following their incubation with control liposomes or TRA-liposomes followed by ultrasound (US) sonication (35-kHz) for 5 min at a power density of 20 mW/cm2. Untreated cells served as a negative control for background fluorescence. An average of 1 × 10⁴ cells was analyzed from each sample with calcein fluorescence intensity showed on a four-decade log scale.

