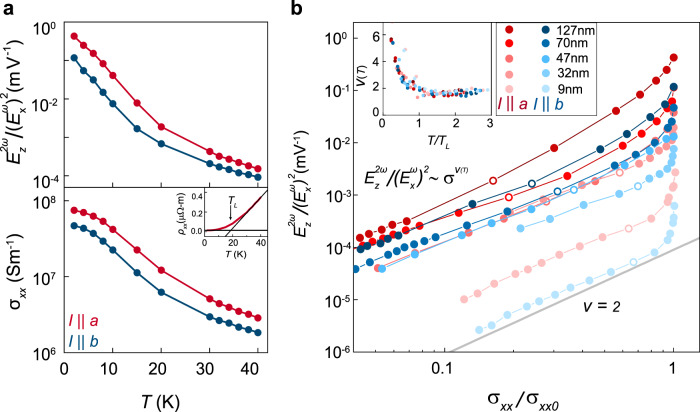
Fig. 3. Scaling of the NLAHE with sample conductivity.
a Main panel: and vs. temperature for and in 127-nm-thick sample. Inset: longitudinal resistivity vs. temperature for in same sample. crosses over from linear temperature dependence to saturation below . b Main panel: vs. for all four samples along a and b axes. All traces show scaling close to a power law with exponent of 2 at lower conductivity (higher temperature) and exhibits an upturn as approaches . Open circles mark the data points taken at the temperature closest to . Inset: local scaling exponent vs. temperature . continually increases above 2 for all traces below .

