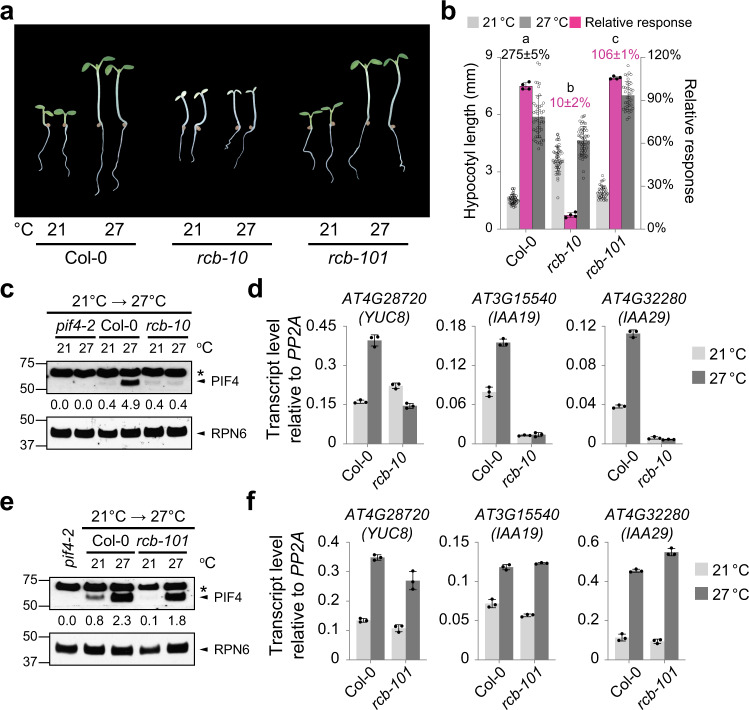
Fig. 5. RCB is required for thermoresponsive PIF4 accumulation.
a Representative images of 4-d-old Col-0, rcb-10, and rcb-101 seedlings grown in 50 μmol m−2 s−1 R light at either 21 or 27 °C. b Hypocotyl length measurements of the seedlings shown in (a). The light- and dark-gray columns represent hypocotyl length measurements in 21 °C and 27 °C, respectively. The percent increase in hypocotyl length (mean ± s.d., n = 3 biological replicates) of Col-0 at 27 °C is shown in black above its columns. The magenta columns show the relative response. Error bars for the hypocotyl measurements represent the s.d. (n > 30 seedlings); error bars for the relative responses represent the s.d. of four biological replicates. The centers of the error bars represent the mean values. Purple numbers show the mean ± s.d. values of relative responses and different letters denote statistically significant differences in relative responses (ANOVA, Tukey’s HSD, p < 0.01, n = 4 biological replicates). c Immunoblot analysis of the PIF4 levels in Col-0 and rcb-10 during the 21 to 27 °C transition. Samples were collected before (21 °C) and 4 h after (27 °C) the warm-temperature treatment. d qRT-PCR analysis of the steady-state transcript levels of YUC8, IAA19, and IAA29 in Col-0 and rcb-10 during the 21 to 27 °C transition. e Immunoblot analysis of the PIF4 levels in Col-0 and rcb-101 during the 21 to 27 °C transition. For (c, e), seedlings were grown in 50 μmol m−2 s−1 R light for 96 h and then transferred to 27 °C. RPN6 was used as a loading control. The relative levels of PIF4, normalized to RPN6, are shown underneath the respective immunoblots. The asterisks indicate non-specific bands. The immunoblot experiments were independently repeated at least three times, and the results of one representative experiment are shown. f qRT-PCR analysis of the steady-state transcript levels of YUC8, IAA19, and IAA29 in Col-0 and rcb-101 during the 21 to 27 °C transition. For (d, f), transcript levels were calculated relative to those of PP2A. Error bars represent the s.d. of three biological replicates. The centers of the error bars represent the mean values. The source data of the hypocotyl measurements in (b), the immunoblots in (c, e), and the qRT-PCR data in (d, f) are provided in the Source Data file.

