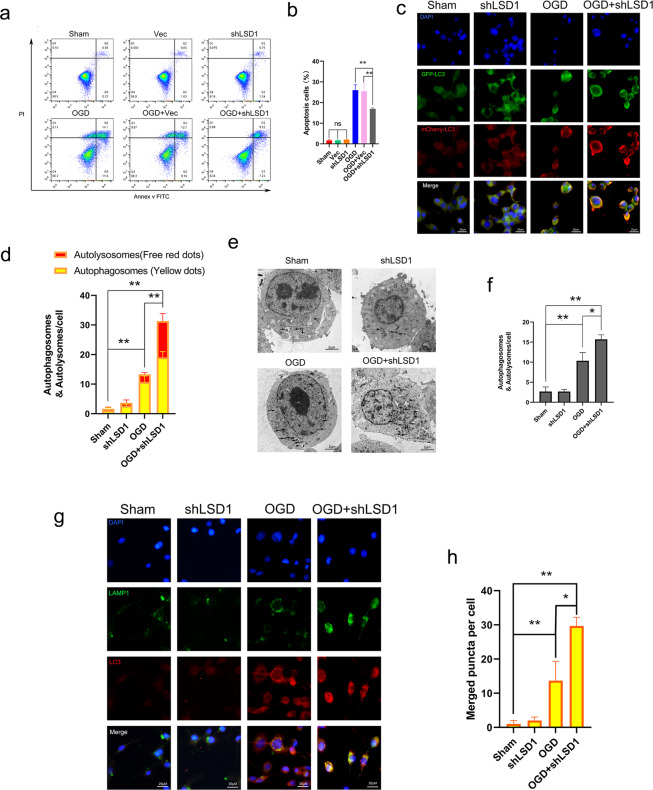
Fig. 5. Knockdown of LSD1 upgraded autophagy and downgraded apoptosis in vitro.
a Annexin V/FITC/PI double staining and flow cytometry detected OGD-induced PC12 apoptosis including or not including LSD1 knockdown. b Quantitative results for apoptotic PC12 cells with LSD1 knockdown treatment or lack of treatment. c, d High magnification fluorescence microscope image of the autophagic flux of mCherry-GFP-LC3 transfected PC12 cells. Autophagosomes were labeled with red and green fluorescence (yellow dots); autophagic lysosomes were labeled with red fluorescence (red dots). The OGD + shLSD1 group had more of these dots compared to the OGD group. Scale bar = 20 μm. e, f Transmission electron microscopy of autophagosomes of PC12 cells. Sample images indicate usual autophagosomes and autolysomes inside shLSD1-treated OGD PC12 cells. g, h Immunofluorescent image showing double-labeling with LC3B (an autophagic biomarker, red puncta) and LAMP1 (a lysosomal biomarker, green puncta). The OGD + shLSD1 group had more of merged puncta (yellow puncta) compared to the OGD group. Scale bar = 2 μm. One-way ANOVA and Tukey’s multiple comparisons test was used to compute p values for mean ± SD of three independent experiments. *p < 0.05; **p < 0.01.

