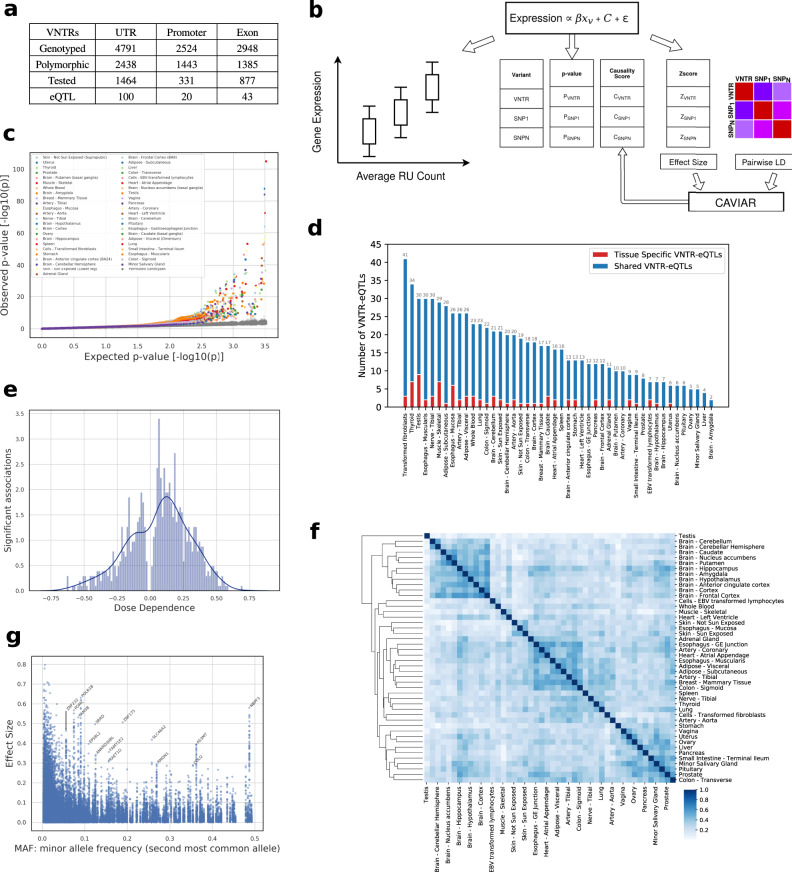
Fig. 2. Effect of VNTR genotypes on mediating gene expression.
a Location of target VNTRs and eVNTRs relative to the proximal genes. b Pipeline to identify eVNTRs and assign causality scores. Ancestry, Sex, and PEER factors are included in C as covariates. We associate VNTR genotype with expression residuals after correcting for the effect of C. c Quantile-quantile plot showing p values of association signals separated by tissue. Green line represents the p values using 100 permutations. d Number of unique and shared eVNTRs in each tissue. e Trend of RU count correlation with gene expression level. f Spearman correlation of eVNTRs effect sizes for each pair of tissues. g Scatter plot correlating effect size versus minor allele frequency (MAF). Source data are provided as a Source Data file.

