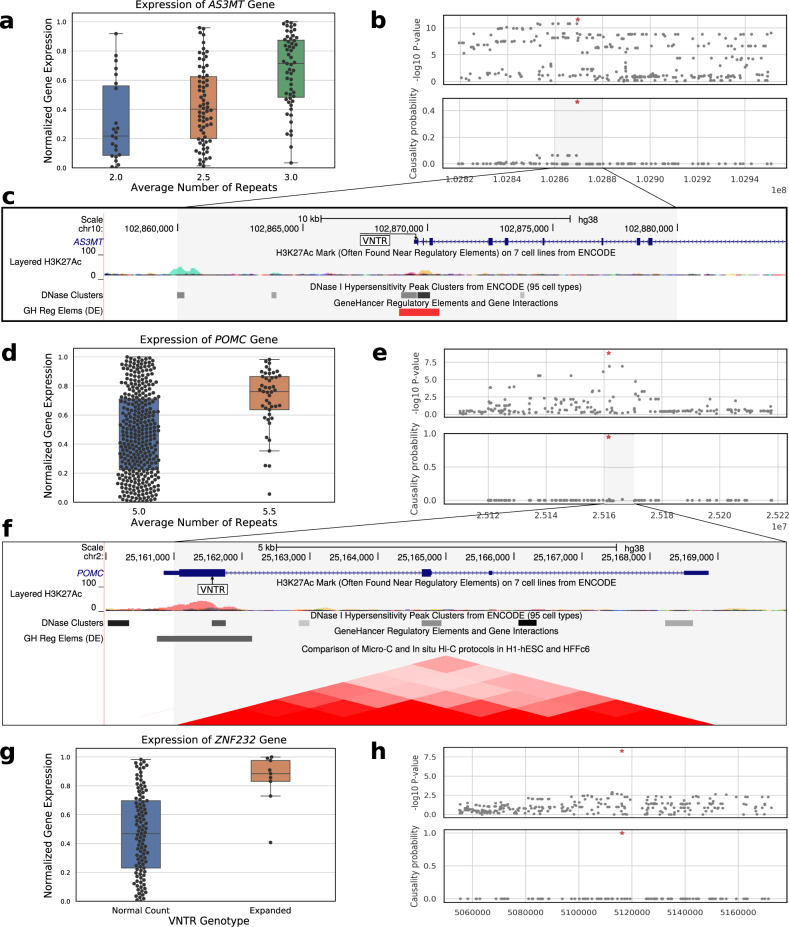
Fig. 3. Effect of VNTR genotypes on mediating gene expression.
a Association of AS3MT VNTR genotype with gene expression in brain cortex (n = 148 samples, Fisher’s two-sided P: 2.78 × 10⁻¹²). Box plots display the median, 25th and 75th percentiles. b Association with gene expression (upper panel) and CAVIAR causality probability of proximal SNPs—all SNPs in 100 kbp window on either side of the AS3MT VNTR (red-star). c Location of AS3MT VNTR relative to known regulatory elements. d, e Association with gene expression of the POMC VNTR (n = 378 samples, Fisher’s two-sided P: 1.53 × 10⁻⁹) and its causality probability relative to proximal SNPs. Box plots display the median, 25th and 75th percentiles. f Location of POMC VNTR relative to other regulatory regions and its spatial proximity with the promoter region revealed via Hi-C. g, h Association with gene expression of the ZNF232 VNTR (n = 114 samples, Fisher’s two-sided P: 5.47 × 10⁻⁹) and its causality score relative to proximal SNPs. Box plots display the median, 25th and 75th percentiles. Source data are provided as a Source Data file.

