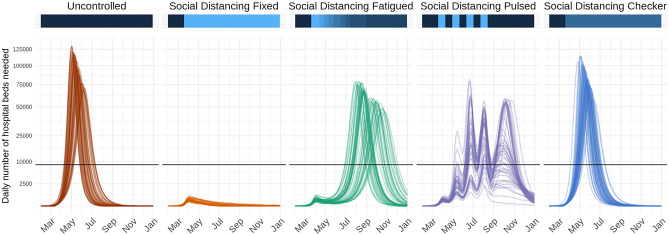
Figure 2.
Time series of daily number of hospital beds needed across five possible intervention scenarios in a fictional location with nine counties. Lines represent results from 50 stochastic model simulations. Horizontal black lines represent the total hospital bed capacity in the fictional location, assumed to be n = 8661 (3 beds per 1000 population). The colored horizontal bars along the top visualize the effectiveness of interventions at a given time point along a dark blue to light blue spectrum; dark blue indicates a period with no reductions to transmission, while light blue indicates a period with more restrictive action (i.e., low transmissibility). In the fifth scenario, “Social Distancing Checker,” only three of nine counties implement any non-pharmaceutical interventions, thus differentiating it from “Social Distancing Fixed”.

