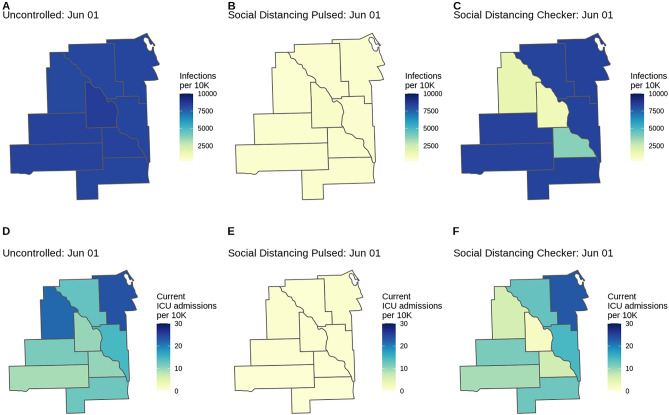
Figure 4.
County-level COVID-19 risk for three scenarios (Uncontrolled, Pulsed, Checker) in the fictional Location X. Choropleths for model outcomes on June 1, 2020 of the (A–C) cumulative infection rate per 10,000 population and (D–F) number of patients currently admitted to the ICU per 10,000 population for the Uncontrolled, Social Distancing Pulsed, and Social Distancing Checker intervention scenarios. County-level variation in attack rates can arise from differences in risk of importation, mobility patterns connecting subdivisions, and differences in non-pharmaceutical interventions applied in each location. If location-specific health outcome risks are specified (as are age-standardized health outcome risks in this example), this may serve as another source of county-level variation.

