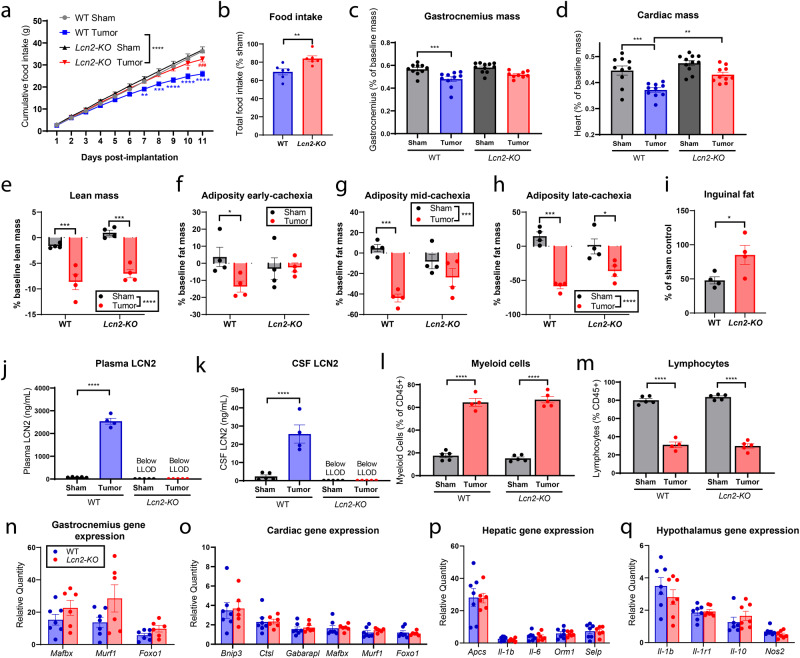
Fig. 3. Genetic deletion of LCN2 ameliorates cachexia–anorexia.
a Cumulative and b total food intake for WT and Lcn2-KO mice after receiving tumor implantations or sham operations (n = 6 per group for WT sham, WT tumor, and Lcn2-KO tumor groups; n = 7 for Lcn2-KO sham controls). c Terminal gastrocnemius and d heart mass as a percentage of baseline body mass (n = 10 per group in WT sham, WT tumor, and Lcn2-KO tumor groups; n = 11 in Lcn2-KO sham controls). e NMR body composition analysis of terminal tumor-free lean (n = 4 per group). f–h NMR body composition analysis of fat mass at early (study day 4), mid (study day 8), and late (study day 11) cachexia (n = 4 per group). i Terminal inguinal fat pad mass normalized to genotype control (n = 4 per group). j Terminal plasma and k cerebrospinal fluid LCN2 levels (n = 5 per group for WT Sham, Lcn2-KO sham, and Lcn2-KO tumor groups; n = 4 for the WT tumor group). l Proportions of myeloid and m lymphoid cells as a percentage of CD45+ cells (n = 5 per group for WT Sham, Lcn2-KO sham, and Lcn2-KO tumor groups; n = 4 for the WT tumor group). n Ubiquitin proteasome pathway gene expression in the gastrocnemius. o Ubiquitin proteasome and autophagy-related gene expression in cardiac muscle. p Hepatic expression of acute-phase- and inflammatory-related transcripts. q Hypothalamic gene expression of inflammation-related transcripts. For n–q, n = 6 per group for WT sham and Lcn2-KO tumor groups; n = 7 for Lcn2-KO sham and WT tumor, groups. All gene expression data represented as fold change over genotype-matched controls. No difference was observed in baseline expression of transcripts between WT and Lcn2-KO mice. All data expressed as mean ± SEM. Cumulative food intake data were analyzed by a repeated-measures Two-way ANOVA followed by Bonferroni’s post hoc test. Food intake and inguinal fat mass as % of sham was analyzed by two-tailed Student’s t test. All other data (c–h, j–q) were analyzed by ordinary Two-way ANOVA followed by Bonferroni’s post hoc test. *p ≤ 0.05, **p ≤ 0.01, ***p ≤ 0.001, and ****p ≤ 0.0001. LLOD lower limit of detection. a–d, j, k, n–q Gray = WT sham operation control; black = Lcn2-KO sham operation control; blue = WT KPC-engrafted mice; red = Lcn2-KO KPC-engrafted mice. e–i, l, m Sham operation controls = gray/black, KPC-engrafted mice = red.

