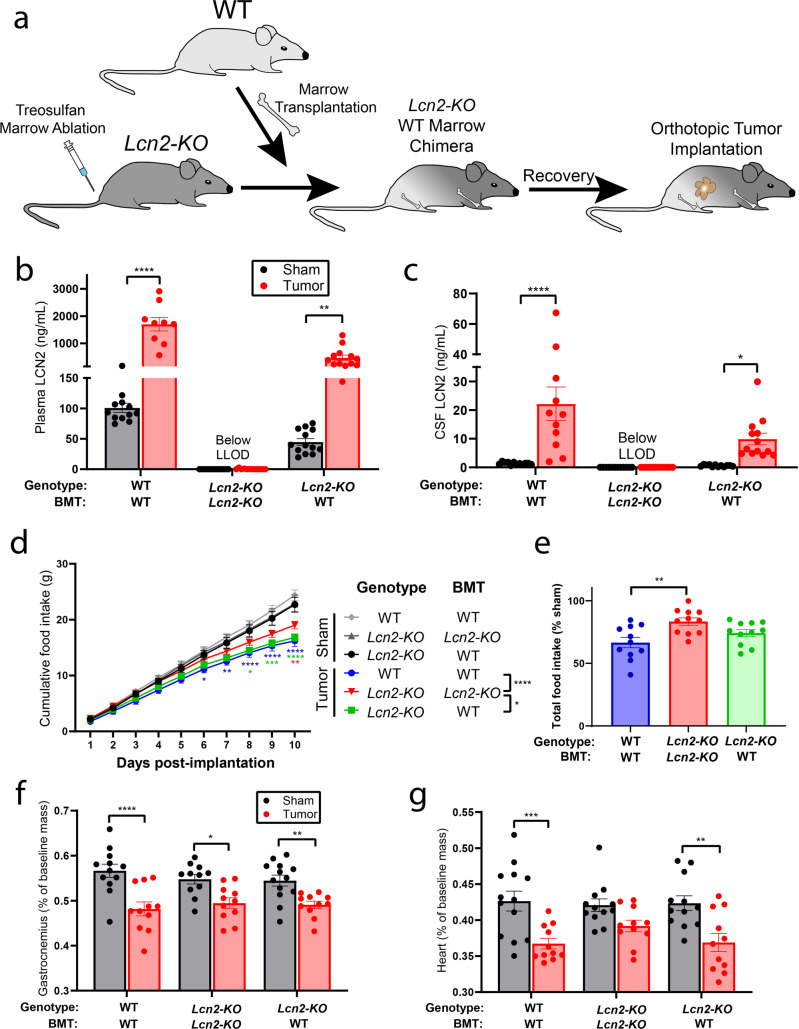
Fig. 5. LCN2 readily crosses the BBB and its expression in the bone marrow is sufficient to induce appetite suppression during pancreatic cancer cachexia.
a Experimental design of bone marrow transplantation experiments. b Terminal peripheral and c central LCN2 levels. d Cumulative food intake and e total food intake as a percent of sham control. f Terminal gastrocnemius and g cardiac tissue mass normalized to baseline mass. b, c N = 12 for WT/WT-BM sham, Lcn2-KO/KO-BMT sham, and Lcn2-KO/KO-BMT KPC-engrafted mice; N = 9 for WT/WT-BM tumor group; N = 13 for Lcn2-KO/WT-BMT sham and Lcn2-KO/WT-BMT KPC-engrafted mice. d–g N = 12 per group for WT/WT-BM sham and Lcn2-KO/KO-BMT sham groups; N = 13 for the Lcn2-KO/WT-BMT sham group; N = 11 per group for WT/WT-BM tumor, Lcn2-KO/WT-BMT tumor, and Lcn2-KO/KO-BMT tumor groups. All data expressed as mean ± SEM. Cumulative food intake data were analyzed by Mixed Model ANOVA with continuous measures followed by Bonferroni’s post hoc test. Total food intake data were analyzed by One-way ANOVA followed by Bonferroni’s post hoc test. All other data were analyzed by Mixed Model ANOVA followed by Bonferroni’s post hoc test. Main column effects were calculated amongst tumor groups in d and are represented in the figure legend. *p ≤ 0.05, **p ≤ 0.01, ***p ≤ 0.001, and ****p ≤ 0.0001. LLOD lower limit of detection. BMT bone marrow transplantation. b, c, f, g Sham operation controls = gray/black, KPC-engrafted mice = red. d, e Light gray = WT/WT-BMT sham operation control, dark gray = Lcn2-KO/Lcn2-KO-BMT sham operation control, black = Lcn2-KO/WT-BMT sham operation control, blue = WT/WT-BMT KPC-engrafted mice, red = Lcn2-KO/Lcn2-KO-BMT KPC-engrafted mice, green = Lcn2-KO/WT-BMT KPC-engrafted mice.

