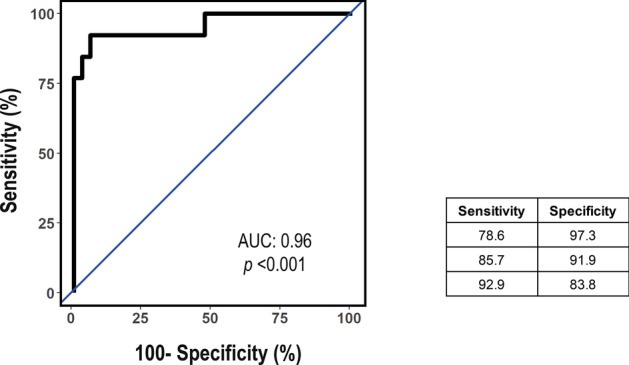
Figure 4.

ROC analysis for the multivariate logistic regression model predicting idiopathic DCMSEV patients. The mean AUC for the averaged ROC curves are presented. The data are presented as the AUC and 95% CI and corresponding sensitivity for a range of specificities. The AUC is 0.96 (95% CI: 0.884–1.00; p < 0.001). Abbreviations: AUC, area under the curve; CI, confidence interval; DCMSEV, dilated cardiomyopathy with ejection fraction ≤ 30%; ROC, receiver operating characteristic.
