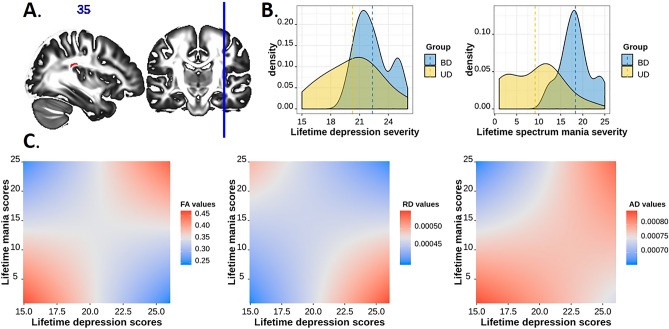
Figure 2.
The effect of lifetime depression by lifetime spectrum mania interaction on FA, RD, and AD values in the cluster spanning the right middle longitudinal fasciculus and the right arcuate fasciculus. (A) The region of significant depression-by-mania effect on FA values in BD-II and UD. (B) The density plots of lifetime depression severity and lifetime spectrum mania scores (per MOODS-SR) in BD-II and UD participants. (C) The illustration of significant depression-by-mania interaction effect on FA, RD, and AD values in BD-II and UD. FA in this cluster was greatest and RD values were lowest at low levels of both lifetime depression and mania and high levels of both lifetime depression and mania; AD values were lowest at high levels of mania and low depression.

