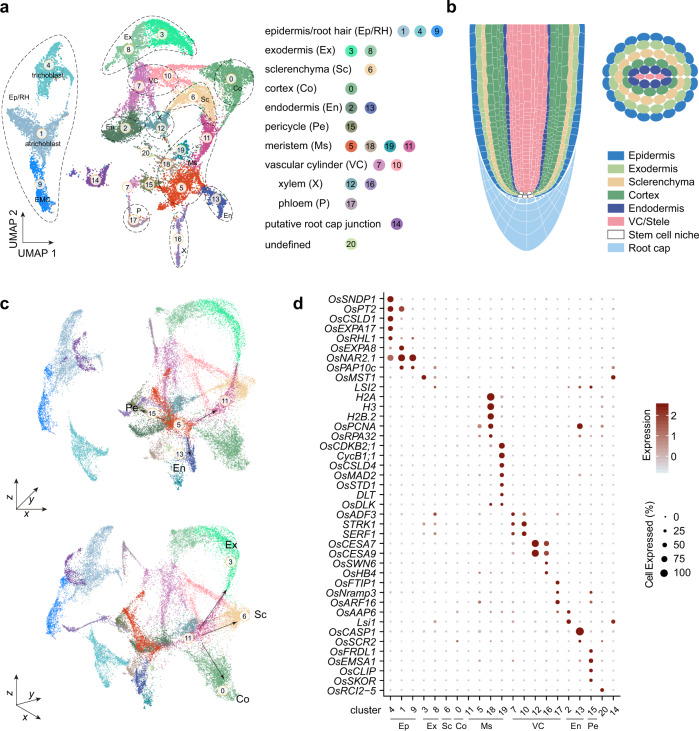
Fig. 1. Generation of a rice radicle cell atlas.
a UMAP visualization of 21 cell clusters in rice radicles. Each dot denotes a single cell. Colors denote corresponding cell clusters. EMC, epidermal meristematic cell. b Schematic of anatomy of rice radicle. c Visualization of cell clusters by 3D UMAP scatterplots. Cluster names and colors are the same as in a. d Expression patterns of representative cluster-specific marker genes on UMAP. Dot diameter indicates the proportion of cluster cells expressing a given gene. The full names of selected genes are given in Supplementary Data 3.

