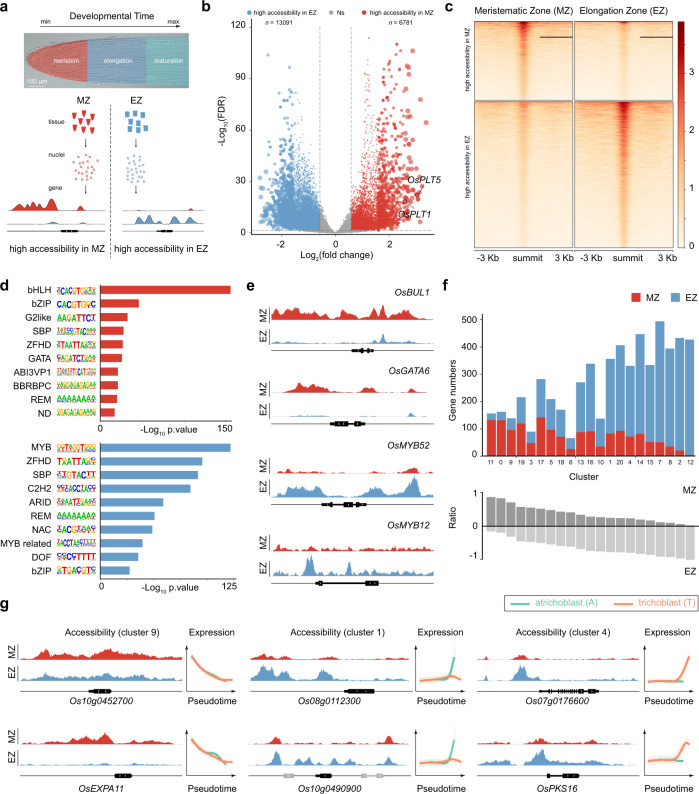
Fig. 4. Inference of transcriptional regulatory basis by ATAC-seq and scRNA-seq.
a Schematic of tissue sampling. MZ, meristematic zone; EZ, elongation zone. b Volcano plot showing differentially accessible peaks between the MZ and EZ samples. Blue and red, highly accessible peaks in the EZ and MZ samples, respectively; Gray, no difference between the MZ and EZ samples. The number of differential peaks in each sample is given. FDR < 0.05; log2(fold change) > 0.58 or <−0.58. c Pileup of ATAC-seq signals. Heat maps are ranked in decreasing order of ATAC-seq signal. Window size: peak summit ±3.0 kb. d Enrichment of transcription factor binding motifs within differential peaks in the MZ (red, top) and EZ (blue, bottom) samples. −Log10(p value) for each binding motif is given. e Representative ATAC-seq tracks for bHLH (OsBUL1), GATA (OsGATA6) and MYB (OsMYB12 and OsMYB52) transcription factor family genes. The genomic loci are shown, and the representative genes are highlighted in black. f Integrative analysis of scRNA-seq and ATAC-seq data. The genes associated with differential peaks identified in c were assigned to 21 cell clusters. The number of genes showing high accessibility in the MZ or EZ in each cell cluster is shown in different colors (top). The ratio (bottom) was calculated by the number of genes showing high accessibility in the MZ or EZ sample/total number of cluster-specific genes. g Representative ATAC-seq tracks for clusters 1, 4, 9 enriched genes. The genomic loci are shown, and the representative genes are highlighted in black. Two representative genes for each cluster are shown. Gene expression patterns during differentiation toward trichoblast (T) and atrichoblast (A) along the pseudotime are shown (right). Color annotation is the same in Fig. 2e.

