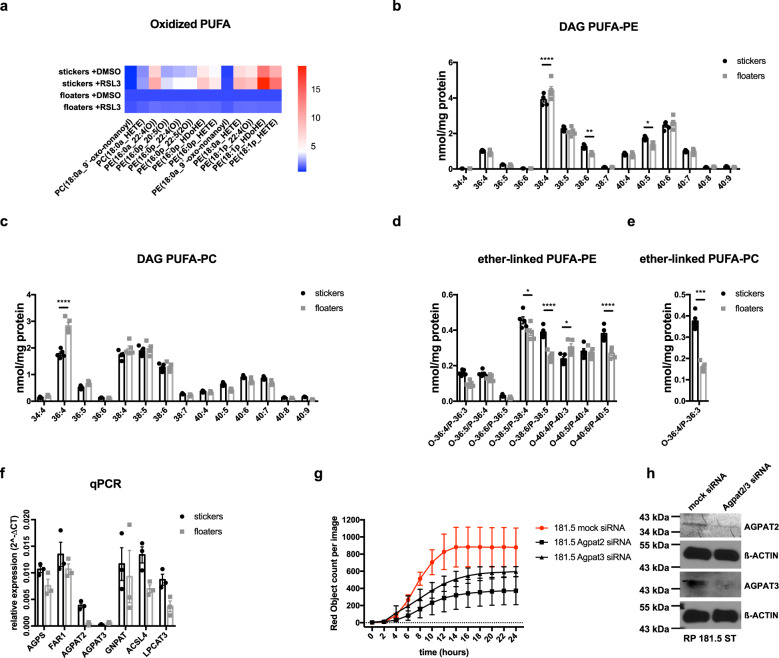
Fig. 4. non-NE/NE SCLC subtypes undergo lipid metabolism remodeling.
a Heatmap showing the representation of mono-oxidized phospholipid species (PE phosphatidylethanolamine; PC phosphatidylcholine) in 181.5 stickers as compared to 181.5 floaters treated with either DMSO or RSL3 [1 µM] for 5 h and then subjected to lipidomics. Samples for each condition (n = 5) were averaged and normalized to the cell number (2.5 × 10⁶). Each lipid species was normalized to levels detected in floaters +DMSO. One representative out of two independent experiments is shown. Heatmap color code indicates normalized lipid species levels of each sample. b–e 181.5 stickers floaters (n = 5 samples) as compared to 181.5 floaters (n = 5 samples) were analyzed for basal diacylglycerol (DAG) and ether-linked lipids by mass spectrometry. Lipid content was normalized to infused protein for each condition and replicate. Individual PUFAs (4 double bonds or more) are plotted. f RNA was isolated from three stickers/floaters lines (RP181.5; RP246.7; BYC5.1), respective cDNA obtained and qPCR performed for the indicated transcripts. g RP181.5 were subjected to the indicated siRNA-mediated knockdowns for 72 h and then treated with RSL3 [1 µM] for an additional 24 h. DRAQ7 [0.1 µM] was added to all wells to visualize dead cells. Images were acquired every 2 h using the IncuCyte S3 bioimaging platform. Dead cells/image are normalized to cell confluence at the beginning of RSL3 treatment. h Representative western blots are shown. Data are means ± SEM of three independent experiments or representative images if not indicated otherwise. Two-tailed unpaired t tests (e) Two-way ANOVA + Tukey’s multiple comparison test, ****p < 0.0001, ***p < 0.001, **p < 0.01, *p < 0.05. Source data are provided as Source data file.

