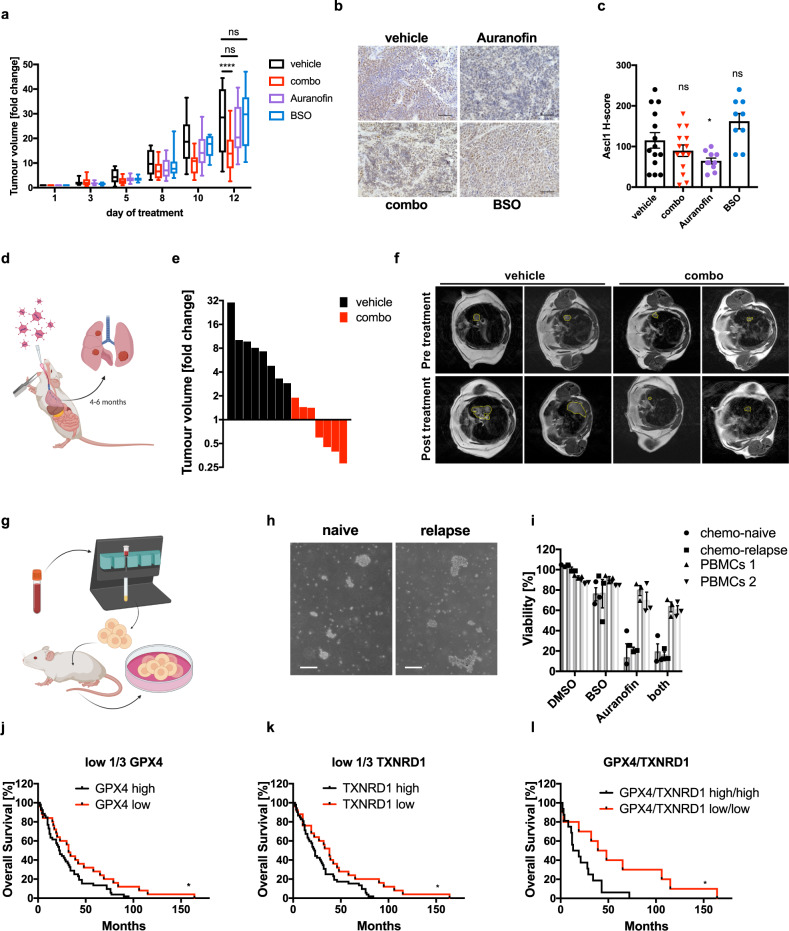
Fig. 6. Combined ferroptosis induction and TRX pathway inhibition demonstrates broad anti-tumor activity across SCLC NE subtypes in vivo and serves as prognostic marker set in human SCLC.
a Eight-weeks-old male nude mice were injected with 50:50 mixed 181.5 stickers and floaters at a total of 1.5 × 10⁶ cells into both flanks. Once palpable, tumors were treated either with vehicle (n = 14), Auranofin [2.5 mg/kg] (n = 10) 3× per week i.p., BSO [5 mM] (n = 10) in the drinking water or the combination (combo) (n = 14) for 2 consecutive weeks. Fold change of initial tumor size is shown. Boxplot center line, mean; box limits, upper and lower quartile; whiskers min. to max. b Sections from paraffin-embedded tumors stained for ASCL1. Representative images are shown, scale bar = 100 µm. c ASCL1 H-score was quantified, n (vehicle) = 14, n (BSO) = 9, n (Aura) = 10, n (combo) = 14. d Eight to twelve-week-old RP mice were inhaled intratracheally with 2.5 × 10⁷ plaque-forming units (PFU) Adeno-Cre virus to initiate SCLC development. e Tumor-bearing RP-mice were treated either with vehicle (n = 8) or combined BSO [5 mM] in the drinking water and Auranofin 3× per week i.p. [2.5 mg/kg] (n = 7) for 2 consecutive weeks. Fold change in tumor volumes was determined by quantifying initial tumor volume from MRI scans as compared to tumor volume at the end of the treatment cycle using Horos software. f Representative MRI images pre and post treatment of mice as in (e). g Isolation scheme of human CDXs. h Cellular morphology of human CDXs, scale bar = 400 µm. i Two CDXs or two healthy donor PBMCs were treated with DMSO, BSO [PBMCs, 500 μM; CDXs, 50 μM], Auranofin [250 nM] or BSO [PBMCs, 500 μM; CDXs, 50 μM]/Auranofin [250 nM] for 24 h, cell viability was quantified by Cell Titer Blue (CDXs) or flow cytometric quantification of propidium iodide (PI)-negative cells (PBMCs). j Kaplan–Meier survival curves for SCLC patients (n = 77)7 containing low (low 1/3 n = 25, median survival 33 months) or high (high 2/3 n = 52, median survival 22.5 months) expression of GPX4 mRNA. k As in (j) expression of TXNRD1 mRNA was correlated using the same cut-off (low = 1/3, median survival 38 months; high 2/3, median survival 22.5 months). l Kaplan–Meier survival curves for SCLC patients with combined low or high GPX4 and TXNRD1 mRNA expression (low/low n = 10, median survival 43.5 months; high/high n = 16, median survival 16 months). Data are means ± SEM were applicable (i). Schemes were drawn with fully licensed Biorender.com. Two-tailed unpaired t tests (a, c), or two-sided log-rank (Mantel–Cox) test (j–i), ***p < 0.001, *p < 0.05, ns p > 0.05. Source Data are provided as Source data file.

