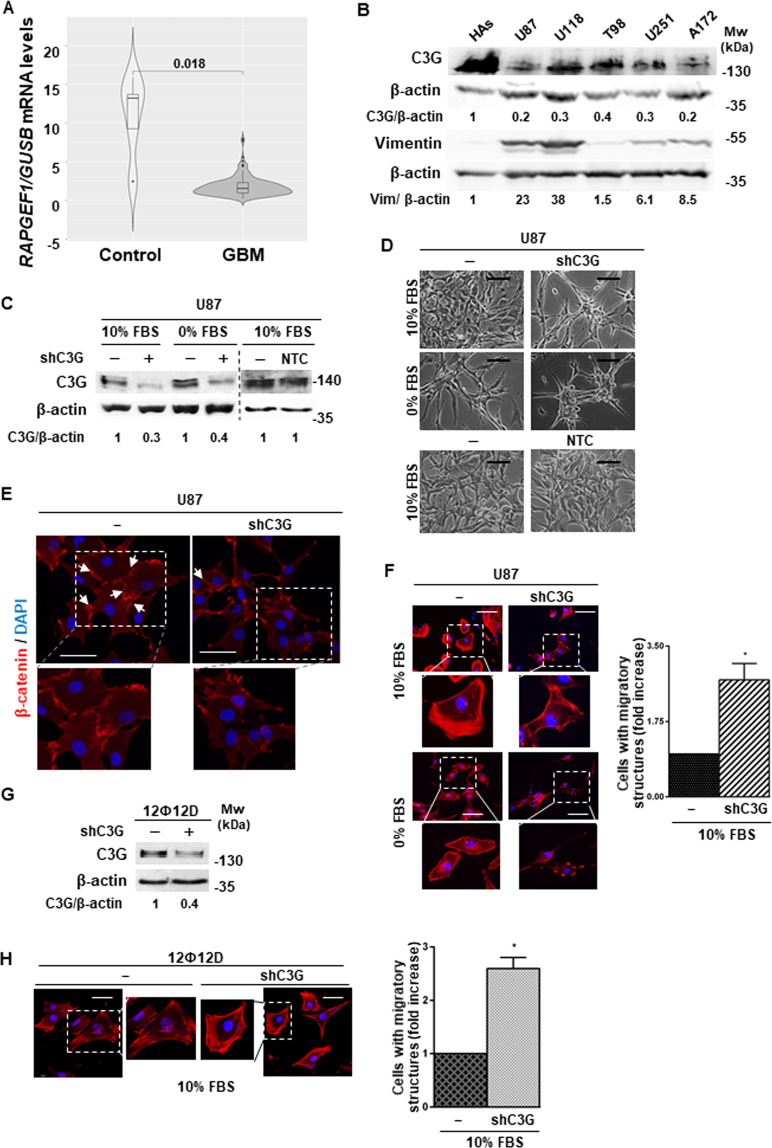
Fig. 1. C3G is downregulated in GBM promoting changes in cell morphology.
A C3G (RAPGEF1) mRNA levels in GBM patients and normal brain (171 patients) obtained from TCGA database normalized with GUSB. B Western-blot analysis of C3G and Vimentin protein levels in the indicated GBM cell lines and human astrocytes (HAs) normalized to β-actin. Densitometric quantification of C3G/β-actin and Vimentin/β-actin ratios are shown. C, G Western-blot analysis of C3G normalized to β-actin to confirm silencing in U87 and 12Ф12D cells as compared to parental cells and/or cells with control shRNA (NTC). Densitometric quantification of C3G/β-actin ratio is shown. D Phase-contrast microscopy images of parental U87, U87shC3G and NTC cells maintained either in the presence (10% FBS) or absence (0% FBS) of serum for 24 h. Scale bars: 50 µm. E Representative images of β-catenin (red) and DAPI (blue) staining analyzed by confocal microscopy. Scale bars: 25 µm. F and H Left panels, immuno-fluorescence microscopy images of phalloidin staining (red) in parental and C3G-silenced U87 and 12Ф12D cells, maintained as indicated. Cell nuclei were stained with DAPI (blue). Scale bars: 50 µm. An amplification of cells inside the square is also shown. Right panels, histograms showing the quantification of the number of cells presenting migratory structures (filopodia, blebs, stress fibers and/or lamellipodia) expressed as fold increase.

