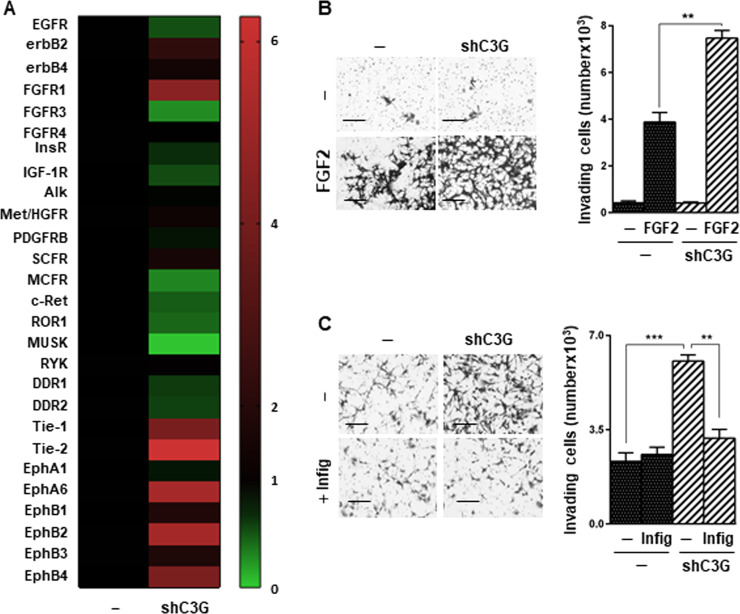
Fig. 6. C3G downregulation increases the phosphorylation of FGFR1 and other RTKs, promoting cell invasion.
A Heatmap represents the relative phosphorylation levels of 27 RTKs present in the proteome profiler human phospho-RTK array. For each receptor, the mean value of the densitometric quantification of C3G silenced cells values as compared to parental cells (n = 2). B FGF2-induced invasion. Cells seeded in the upper chamber of transwells were maintained in the absence of serum and were treated with FGF2. Left panel, representative phase contrast microscopy images of invading cells; right panel, histogram showing the mean value ± S.E.M. of the total number of invading cells (n = 3). *p ≤ 0.05 and **p ≤ 0.01, compared as indicated. Scale bars: 100 µm. C Effect of infigratinib on invasion using serum (10%) as chemoattractant. Left panels, representative phase contrast microscopy images of invading cells; right panel, histogram showing the mean value ± S.E.M. of the total number of invading cells (n = 3). **p ≤ 0.01 and ***p ≤ 0.001, compared as indicated. Scale bars: 100 µm.

