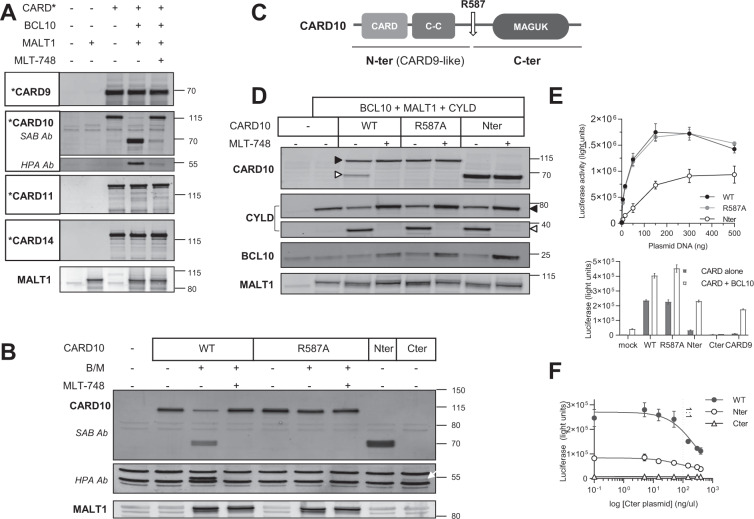
Fig. 1. MALT1 cleaves CARD10 at R587.
A CBM reconstitution assay in HEK 293T cells. Plasmids encoding MALT1, BCL10, and CARD* (either CARD9, CARD10, CARD11, or CARD14) were transfected in HEK 293T cells, alone or in combination, ± 1 µM of MLT-748. Western blot showing the obtained band pattern for each CARD protein. This is one of three experiments with similar results. Plasmids encoding GoF mutant forms of CARD11 and CARD14 were also tested, leading to similar results as those shown here with WT forms. B CARD10 constructs were transfected alone or co-transfected with BCL10 and MALT1 (B/M) ± 1 µM of MLT-748. The C-terminal fragment of CARD10 was unstable when overexpressed alone (Fig. 1B, last lane). This is one of three experiments with similar results. C Schematic representation of CARD10 including the protein domains and localization of the MALT1-dependent cleavage site at R587. D The CARD10 constructs were co-transfected with MALT1 and BCL10 together with the MALT1 substrate CYLD, ± 1 µM of MLT-748. Protein expression and post-activation changes were assessed by Western blot. Full-length proteins are annotated with closed triangles and cleaved fragments with open triangles. Cleaved BCL10 is difficult to detect as it is very similar in size to full length BCL10 and because it is rapidly degraded. Full length BCL10 levels are stabilized by addition of MLT-748, which indirectly accounts for BCL10 cleavage, as demonstrated previously25. MALT1 self-cleavage band and mono-ubiquitinated species are visible on the membrane, accounting for stimulation in the absence or presence of a MALT1 inhibitor, respectively, as described previously25. This is one of three experiments with similar results. E Top, NF-κB reporter luciferase assay after transfection of increasing concentrations of plasmids encoding either CARD10-WT (1–1032) (black filled circles), R587A-CARD10 (grey filled circles), or CARD10-Nter (1–587) (empty circles). Means ± SD of triplicates are shown (N = 4); bottom, NF-κB reporter luciferase assay after transfection of CARD10 constructs or CARD9, alone (filled bars) or together with BCL10 (empty bars). Means ± SD of triplicates are shown (N = 3). F NF-κB reporter luciferase assay upon transfection of CARD10 WT (filled circles), Nter (empty circles), or mock (empty triangles) together with increasing doses of CARD10-Cter plasmid (588–1032); the dotted line indicates the 1:1 dosed vs. tested plasmid ratio. Means ± SD of triplicates are shown (N = 4).

