Figure 2.
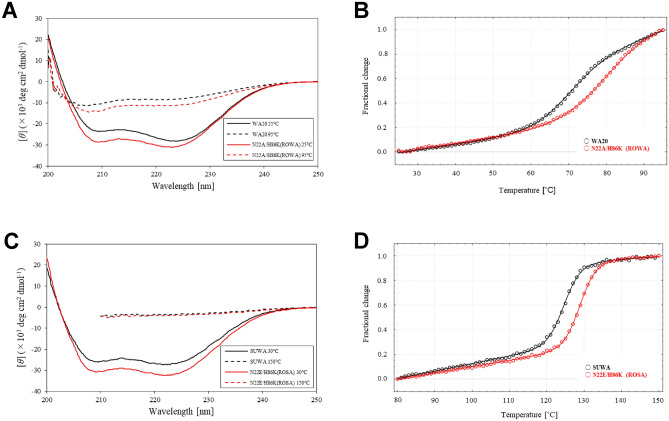
CD spectra and thermal denaturation curves. (A) CD spectra of WA20 and the N22A/H86K mutant of WA20 (ROWA) at 25 and 95 °C. (B) Thermal denaturation curves of WA20 and ROWA. The Tm values of the WA20 and ROWA proteins are 69.8 ± 0.4 and 80.4 ± 3.5 °C, respectively. (C) CD spectra of SUWA and the N22E/H86K mutant of SUWA (ROSA) at 30 and 150 °C. (D) Thermal denaturation curves of SUWA and ROSA. The Tm values of SUWA and ROSA are 124.7 ± 0.1 and 129.0 ± 0.1 °C, respectively. In the denaturation curves, the Y-axis represents the normalised value of [θ]222 nm. The data of the denaturation curves were fitted to a two-state model with ΔCp fixed to zero and the graphs were created using CDpal33, version 2.18 (https://github.com/PINT-NMR/CDpal/).

