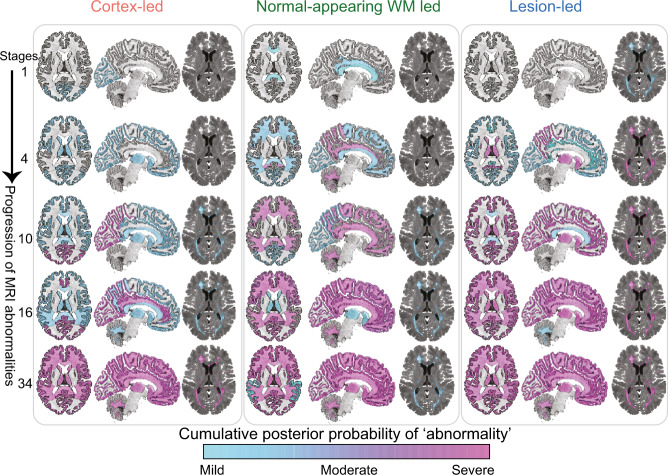
Fig. 1. MRI-based subtypes.
the evolution of MRI abnormalities in each of the three MRI-based subtypes. The colour shade ranges from blue to pink which represents the probability of abnormality (it can be interpreted as the degree of abnormality) (mild, moderate or severe which approximates 1, 2 and 3 sigma). The cortex-led subtype (left) showed cortical atrophy in the occipital, parietal and frontal cortex in the early stages of the sequences, and a reduction in T1/T2 ratio in the NAWM in the later stages. The normal-appearing white matter (NAWM)-led subtype (middle) showed a reduction in T1/T2 ratio of the cingulate bundle and corpus callosum in the earlier stages of the sequence, and deep grey matter and temporal grey matter atrophy in the later stages. The lesion-led subtype (right) shows early and extensive accumulation of lesions in the earlier stages of the sequence, and a reduction in the T1/T2 ratio in the NAWM in the later stages. The numbers on the left side represent SuStaIn stages. The minimum stage is 1 and the maximum stage is 39 (based on 13 variables that show mild (sigma = 1), moderate (sigma = 2) and severe abnormality (sigma = 3)). Acronyms: NAWM, normal-appearing white matter; SD, standard deviation; GM, grey matter; T1/T2, T1-T2 ratio.

