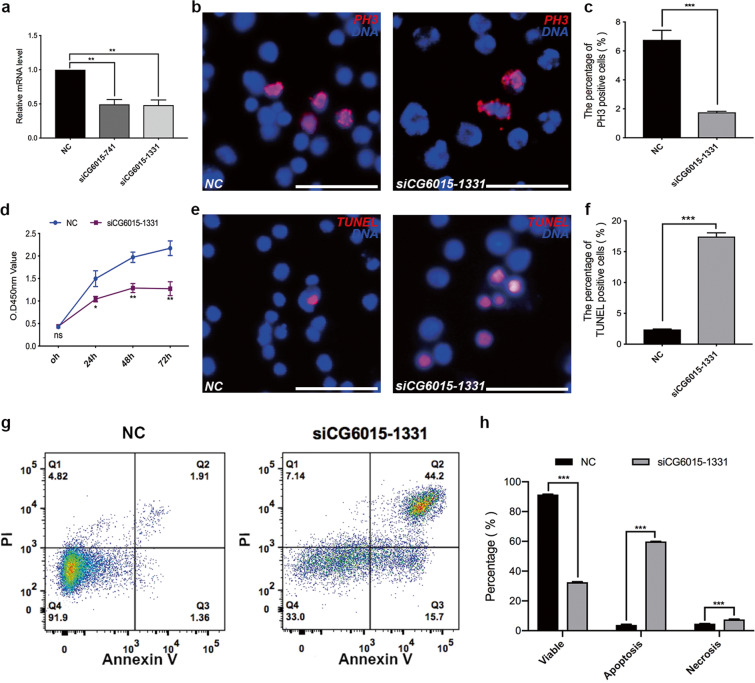
Fig. 3. Functional analysis of CG6015 in S2 cells.
a Relative mRNA levels of CG6015 in the negative control (NC) and siCG6015 (siCG6015-741 and siCG6015-1331)-treated S2 cells to validate knockdown efficiency. b Immunostaining of NC and siCG6015-1331-treated S2 cells by using PH3 (red). c Percentages of PH3-positive cells in NC (n = 3) and siCG6015-1331-treated (n = 3) S2 cells. d CCK-8 test in NC and siCG6015-1331-treated S2 cells. e TUNEL (red) staining in NC and siCG6015-1331-treated S2 cells. f Percentages of TUNEL-positive cells in NC (n = 3) and siCG6015-1331-treated (n = 3) S2 cells. g Cell component analysis in NC and siCG6015-1331-treated S2 cells by flow cytometry. h Percentages of cell components in NC (n = 3) and siCG6015-1331-treated (n = 3) S2 cells. The Student’s t test was used for the statistical analysis. *P < 0.05; **P < 0.01; ***P < 0.001; n.s. not significant. Scale bar: 30 μm.

