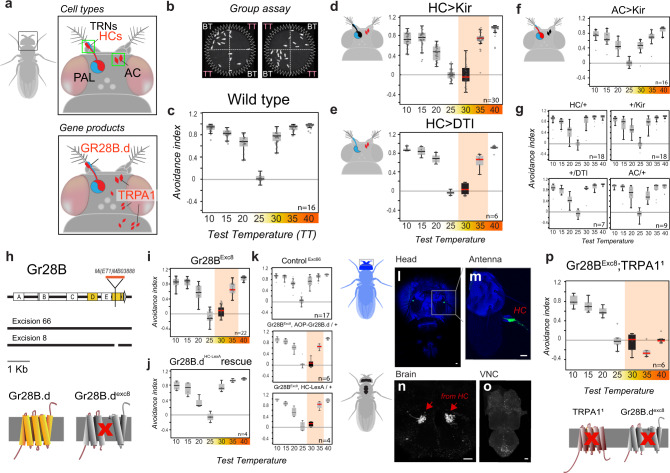
Fig. 1. Noxious and innocuous heat sensing together mediate heat avoidance in Drosophila.
a Schematic representation of the cell types and gene products involved in heat sensing in adult Drosophila (TRNs: temperature receptor neurons, HCs: hot cells, AC: anterior cells, PAL: posterior antennal lobe). b, c Two-choice assay for temperature preference. b Groups of flies are given a choice between a base temperature (BT, 25 °C; n = no. of groups) and a variable test temperature (TT; a single video frame is shown). c Temperature preference is quantified as an avoidance index for the various test temperatures (wild type is shown). d Genetic silencing (by expression of Kir2.1, a hyperpolarizing agent) or (e) ablation (by Diphteria toxin, DTI, a cell killing toxin—under the control of HC-Gal4) of hot TRNs of the arista abolishes avoidance of 30 °C and reduces avoidance of 35 °C. f Genetic silencing of AC (in AC-Gal4>UAS-Kir2.1) has no effect on avoidance. g Control genotypes (drivers and effectors). h Creation of a GR28B null mutant. Schematics of the Gr28B genomic locus, Minos insertion, genomic excisions produced for this work and effect of excisions on the predicted protein. i An excision in one of the common exons (Exc8) abolishes avoidance of 30 °C and reduces avoidance of 35 °C. j Targeting expression of a GR28B.d cDNA to hot-activated TRNs (by HC-LexA) completely rescues avoidance defects. k Controls. l–o HC-LexA expression visualized by GFP (in HC-LexA>Aop-GFP animals). l, m Confocal stacks from head/antennae (blue = cuticle autofluorescence, green = GFP expression in Hot TRNs of the arista; scalebars = 20 μm). n–o 2-photon stacks of brain and ventral nerve chord (VNC), showing (n) hot TRNs axon terminals in the brain, and (o) no labeling in the VNC (scalebars, 20 µm). p Gr28BExc8, TRPA11 double mutants display no heat avoidance, but normal cold avoidance. In all boxplots, the edges of the boxes are the first and third quartiles, a solid line marks the median, and whiskers delimit the data range; a solid red median line denotes a significant interaction between experimental and control animals (two-way ANOVA, P < 0.001), a black box denotes avoidance indexes not significantly different from zero (one sample t test, P < 0.05). See Supplementary Fig. 1 for additional controls. PHC-Kir30 = 3.78e−12, PHC-Kir35 = 6.74e−4; PHC-DTI30 = 1.73e−7, PHC-DTI35 = 2.74e−5; PHC,AC-Kir30 = 1.39e−11, PHC,AC-Kir35 = 4.67e–6; PExc8-30 = 8.12e–18, PExc8-35 = 3.8e–7; PExc8AOP-30 = 5.06e–9; PExc8AOP-35 = 8.01e–6; PExc8lexA-30 = 9.59e−8; PExc8lexA-35 = 6.28e−3; PExc8Df-30 = 4.22e−12, PExc8Df-35 = 4.14e−6; PGR28TRPA1-30 = 2.42e−18, PGR28TRPA1-35 = 1.87e−27, PGR28TRPA1-40 = 1.95e−25, PHC-Kir30 = 0.44; PHC-DTI30 = 0.25; PExc8-30 = 0.06; PExc8Df-30 = 0.24; PGR28TRPA1-30 = 0.50, PGR28TRPA1-40 = 0.80.

