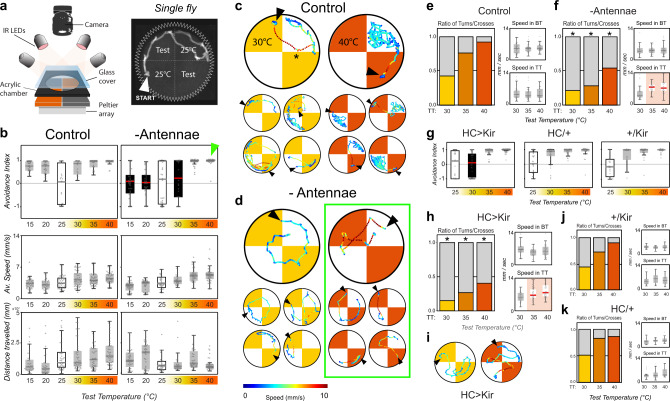
Fig. 2. Thermosensory neurons of the arista guide rapid navigation during thermotaxis.
a Schematic representation of the single fly 2-choice assay for temperature preference. (Test = test temperature). b Avoidance indexes and locomotory parameters of (left) single wild-type control flies and (right) single flies in which the antennae had been surgically removed at eclosion. (Top row) Avoidance indexes. Antenna ablated flies display no avoidance for test temperatures ranging from 15 to 30 °C (a solid red median line denotes a significant difference between experimental and controls, ANOVA: P15 = 1.1e−7, P20 = 3.7e−6, P30 = 2.3e−2; a black box denotes avoidance indexes not different from zero, one-sample t test, P > 0.05). (Center and Bottom row) Quantification of locomotor parameters shows that antenna ablation does not produce major defects in motility (WT: N15 = 27, N20 = 26, N25 = 43, N30 = 55, N35 = 53, N40 = 55, Ablated: N15 = 43, N20 = 36, N25 = 32, N30 = 26, N35 = 38, N40 = 38). c, d Single representative tracks from control and antenna-ablated flies. c Control flies avoid hot quadrants by producing sharp U-turns at cool/hot boundaries (asterisk; note that in all panels arrowheads denote the position of each fly at the start of heating, and that tracks are color-coded by speed). d Antenna ablated flies fail to systematically produce sharp U-turns and instead frequently invade the hot quadrants. e, f Quantification of the ratio of U-turns/border crosses at the cool/hot boundaries and associated locomotor parameters (Ns as in (b)). e In control flies the ratio of U-turns/border crosses increases as a function of the temperature on the hot side, until (for test temperature = 40 °C) most border interactions result in U-turns. f Antenna-ablated flies display significantly smaller fractions of U-turns at the border in all conditions, but instead display a higher speed for traversals of the 35 °C and 40 °C hot quadrants (highlighted in the lower right panel in (f), BT base temperature, TT test temperature). g–i Genetic silencing of hot-activated TRNs of the arista results in phenotypes in the hot range very similar to antenna ablation (HC/Kir: N25 = 29, N30 = 33, N35 = 36, N40 = 46, HC/+: N25 = 27, N30 = 22, N35 = 29, N40 = 26, Kir/+: N25 = 35, N30 = 32, N35 = 26, N40 = 26; 2-way ANOVA: P30 = 1.3e−3). j, k Control genotypes (drivers and effectors). In all boxplots, the edges of the boxes are the first and third quartiles, a solid line marks the median, and whiskers delimit the data range; In (f–k), a solid red median line denotes a significant interaction between experimental and control animals, a black box denotes avoidance indexes not significantly different from zero. Asterisks in (f) and (h) denote significant differences in turn/cross ratios from the appropriate controls (asterisk in (f): GLMM, Wald test: vs Control P30 = 3.3e−2, P35 = 6.4e−11, P40 = 6.5e−6; red line in (f): ANOVA, P35 = 2.1e−5, P40 = 5.1e−6, control (e); asterisks in (h): 2-Way GLMM, Wald test: P30 = 2.3e−3, P35 = 1.6e−6, P40 = 3.0e−2; red line in (h): 2-way ANOVA, P35 = 3.6e−2, P40 = 1.2e−3, controls (j, k)).

