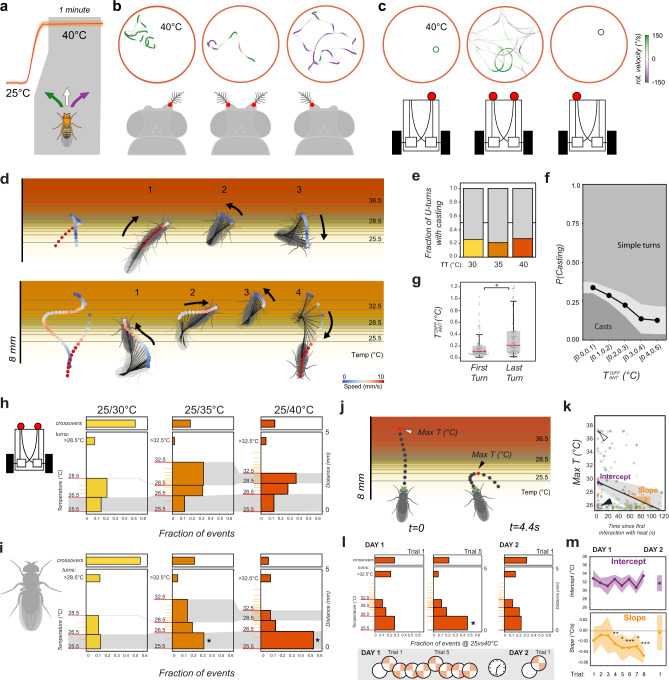
Fig. 6. Comparison of thermotaxis in flies and vehicles reveals latent robustness and plasticity in fly behavior.
a–c Under uniform heat conditions, fly behavior following antenna ablation is less stereotypical that vehicle behavior following sensor ablation. a Schematic of constant-heat experiment. b, c Representative tracks from (b) antenna ablated and control flies and (c) sensor ablated and control vehicles. Track color represents rotational speed (green = leftward rotation, purple = rightward rotation). Unlike flies, sensor-ablated vehicles rotate in place in uniform heat. d–g When navigating the cool/hot boundary, fly behavior is also less stereotypical than that of vehicles. Unlike vehicles, in a fraction of border interactions, flies perform “casting” (defined as at least two changes in direction in close succession) before escaping. d Two examples of casting behavior. e Fraction of escape turns that contain at least one casting event, plotted by experimental condition (N30 = 67/28, N35 = 114/30, N40 = 191/39 turns/animals). f Probability of casting is highest when the approach angle results in a small temperature difference between the antennae (N = 341 interactions from 95 flies; bins = 0.1 °C intervals, gray shading = ±STD, GLMM with Wald test, P = 1.5e−2, Coefficient = −3.12). g The last turn of a casting sequence is often characterized by a larger temperature difference between the antennae, compared with the first turn (box edges = first and third quartiles, solid line = median, whiskers = data range; N=92 casts from 55 animals, LMM, ANOVA, P = 2.2e−4). h–m Fly heat avoidance also displays hallmarks of rapid learning. h, i Compared to vehicles, flies display a disproportionate fraction of early turns (turns in the <26.5 °C region, lower gray shading) in the 25°/35 °C and 25°/40 °C experimental conditions. Histograms represent fraction of U-turns in different regions of the temperature gradients for (h) vehicles and (i) flies (left y-axis = temperature (°C), right y axis = distance (mm); gray shading = similar temperature range across conditions; crossover frequencies are shown at the top; asterisks in i = GLMM, Wald Test, P35 = 1.2e−7, P40 = 1.1e−26; h: N30 = 138/29, N35 = 131/25, N40 = 181/29 events/flies; i: N = 2493,3087, 3109 events/ 400 vehicle simulations each). j–m The dynamics of appearance of early turns suggests an underlying learning process. j Representative tracks showing a border crossing followed by an “early turn” (t = time from first border interaction; arrowheads = maximum temperature at the antennae, Max T, capped at 37 °C for crossings). k Border crossings and deep turns (leading to exposure to high heat) decrease during the course of an experiment in favor of early turns (LMM ANOVA, P = 1.3e−4; gray shading = 95% confidence interval; arrowheads in (k) correspond to events in (j); N = 28 flies). l When naïve flies are subjected to consecutive trials, early turns are significantly increased after five trials (plots as in (h, i); asterisk = GLMM, Wald test, P = 1.3e−2, N = 55 flies, Nevents: ND1T1 = 238, ND1T5 = 264, ND2T1 = 79). Early turn frequency returns to naïve levels after 24 h (right panel). m When considering the maximum temperature experienced at each border interaction, the initial exposure to heat remains constant across trials (intercept, top panel), but, after trial 4, flies rapidly resort to early turns as a strategy to escape heat (negative slope, bottom panel). This effect is reversed after 24 h of rest. Here, max temperature data were extracted and plotted as in (j, k) (points = coefficient from maximum likelihood estimation LMM, shading = 95% confidence interval from parametric bootstrap; asterisks = LMM ANOVA, P4 = 1.4e−3, P5 = 1.7e−2, P6 = 5.5e−5, P7 = 1.7e−2, P8 = 1.4e−9; in (l, m): Nday1 = 55 flies, Nevents: N1 = 108, N2 = 268, N3 = 71, N4 = 338, N5 = 105, N6 = 280, N7 = 103, N8 = 268, Nday2 = 13 flies, Nevents = 71).

