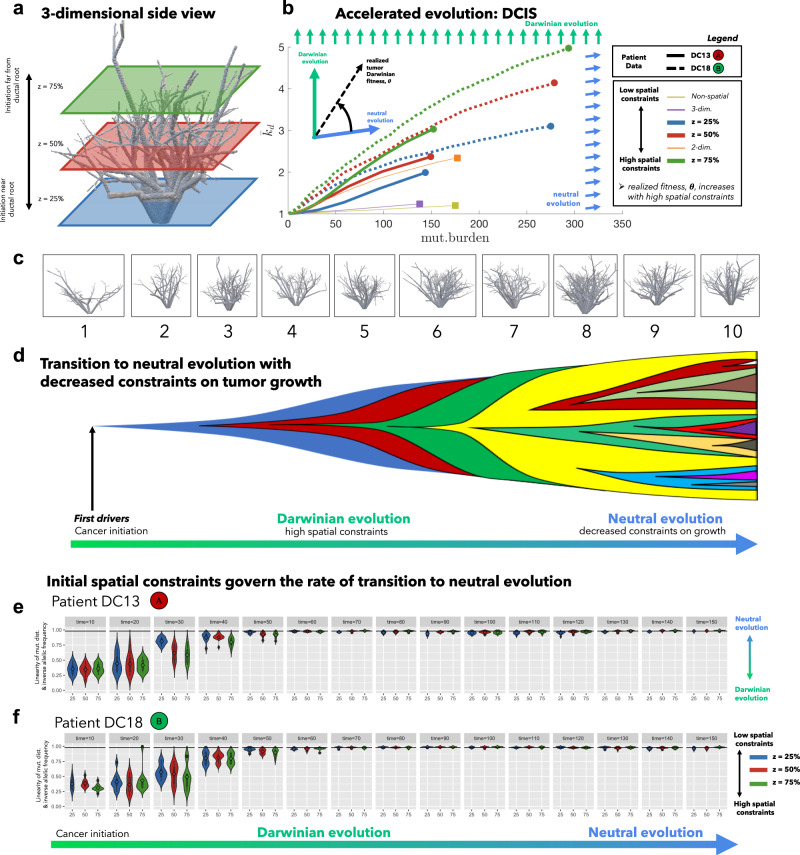
Fig. 4. Three-dimensional model of tumor evolution constrained by ductal network structure.
a Realistic three-dimensional topology of breast ductal networks (reconstructed with data from anthropomorphic breast phantoms in48) provides full three-dimensional maps to seed and constrain tumor evolution simulations. b Tumor evolution is shown for varied points of initiation (z-dimension shown in a), to identical sizes (N = 104 cells). See attached videos V4 and V5. Two parameterizations are shown: DC13 (solid lines; μp = 10−2; μd = 10−3.0; sd = 10−1; sp = 10−3; indicated as red circle (a) in Fig. 3g) and DC16 (solid lines; μp = 10−2; μd = 10−2.5; sd = 10−2; sp = 10−3; indicated as green circle (b) in Fig. 3l). The slope of trajectories (schematic) on this phase portrait is termed “realized tumor Darwinian fitness” and is dependent on spatial constraints at the point of tumor initiation. Simulations closer to the ductal root (e.g., blue curve, z = 25%) in larger, less constrained branches are characterized by a steady left-to-right (neutral) evolution and constant acquisition of new clones. Simulations further from the ductal root (e.g., green, z = 75%) in smaller, more constrained branches are characterized by clonal sweeping (bottom-to-top evolution) early, but with a shift toward neutrality (left-to-right) at later times. Trajectories may be compared to alternative models with identical parameterizations: non-spatial model (dashed yellow), unconstrained two-dimensional model (dashed orange), or unconstrained three-dimensional model (dashed purple). c The analysis is repeated subject to spatial constraints on ten highly distinct anthropomorphic breast phantom ductal network reconstructions. In general, ductal branches far from the root decrease in size and increase in number (see Supplementary Fig. 5). d All simulations tend to follow an initially Darwinian evolutionary trajectory (steep slope) followed by a transition to neutral evolution (shallow slope). e, f An alternative metric of tumor neutrality: the linearity of cumulative mutation distribution with respect to inverse allelic frequency, sometimes called the 1/f power-law distribution5. Although all tumors initially are quantitatively shown to be non-neutral, all eventually progress to neutral or nearly-neutral state (the neutral minimum threshold of 0.985 shown in black). Tumors with initially high spatial constraints (green violin plots) transition to neutral evolution more slowly than those with less spatial constraints (blue violin plots). High spatial constraints enable accelerated evolution over a range of ductal networks in (c) (see Supplementary Fig. 4). Violin plots show median (diamond), 25/75 percentiles, and smallest/largest values within 1.5 times the interquartile range above/below quartiles) for N = 10 simulations for each z value.

