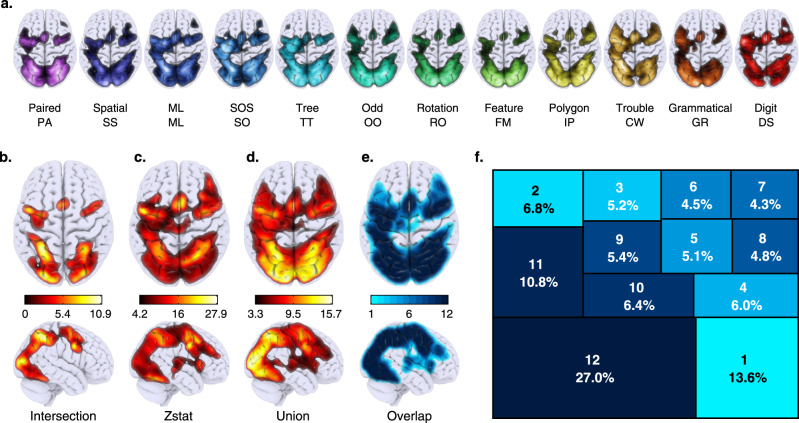
Fig. 1. Domain-general overlap volumes.
We used a cognitive battery designed to measure different aspects of intelligence to collect task-evoked brain activation data from 60 participants. A description of each task is provided in Supplementary Methods A.1 and graphical representations in Fig. S1 and Supplementary movies 1–12. a Maximum intensity projection for the voxel-wise activation patterns (vs resting period) for the 12 cognitive tasks composing our battery. Initials for each task are displayed underneath simplified task names. b–d Maximum intensity projection for the following: b the intersection of the 12 tasks, i.e., voxels that were active for all of the tasks. c t-test across the 12 tasks relative to rest, i.e., tasks that were reliably active for multiple tasks. d Union of the 12 task activation patterns, i.e., voxels that were active for at least one task. e Proportion voxel-wise overlap projection (i.e. the number of tasks a voxel is activated by (darker colour = voxels present in more tasks). f Treemap quantifying the multi-way proportion of logical intersections of positive activation patterns across tasks. Top digit indicating the number of overlapping tasks and the bottom the percentage of voxels existing in the k-way intersection. Colour matches the overlap volume.

