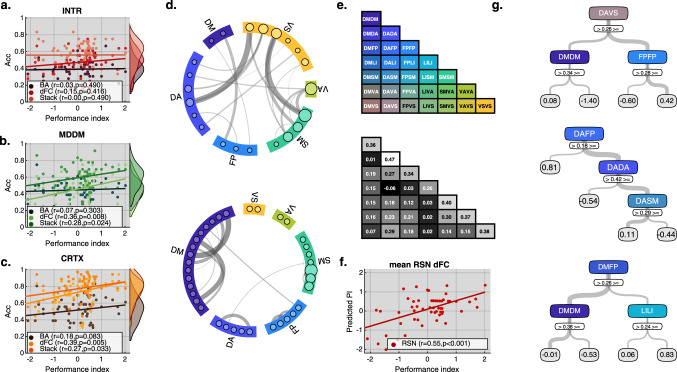
Fig. 6. Cortical connectivity in networks previously defined by resting state analysis (RSN)21 predicts individual task performance.
a–c The following scatter plots test association between overall performance index (PI) across all tasks (x-axis) and classification accuracy (y-axis) using a right-tailed Pearson correlation coefficient test. All tests are FDR corrected. Individuals with higher scores express more accurately classifiable task-evoked network states. Best classification was achieved by the stack models. The strongest correspondence to intelligence was produced by the connectivity (dFC) models. d Schema-ball plots showing top 0.1% of connections that were stable across 58 (i.e. one for each participant) leave-one-out sparse one-vs-all multi-class models. Top panel shows positive weights used to differentiate any one task from the other 11 and is dominated by connections that are between RSNs. Bottom panel shows the negative weights used to identify features that are similar for most tasks and is dominated by connections that are within RSN. e Top panel diagonal shows the seven within RSN labels (i.e. Default mode = DM, Dorsal attention = DA, Frontoparietal = FP, Limbic = LI, Somatomotor = SM, Ventral attention = VA and Visual = VS). The lower triangle shows the 21 unique between RSN combinations. Colours correspond to those in d and g. Bottom panel shows the mean dFC for each of the RSN combinations averaged across the 12 tasks. Using cross-validated leave-one-out grid search we identified the optimal ensemble boosted structure with respect to the maximal number of branch node splits and the maximum number of trees to train (converged on 3 and 3). We then quantified by 58 independent boosted regression trees. f Scatter plot showing the predicted performance index (y-axis) is significantly association (p = 3.59e−6) with the actual performance index (x-axis) as quantified by 58 independent ensemble trees using a right-tailed Pearson correlation coefficient test. g Boosted regression trees trained on the entire sample (i.e. not cross-validated) identified the most important combinations of features for explaining individual differences in performance. Increased connectivity between dorsal attention (DA) and visual (VS) systems was strongly associated with better performance. In contrast, increased connectivity within the default mode (DM) network combined with decreased connectivity between either DA to VS or DM to frontoparietal (FP) was associated with lower performance. Source data are provided as a Source Data file.

