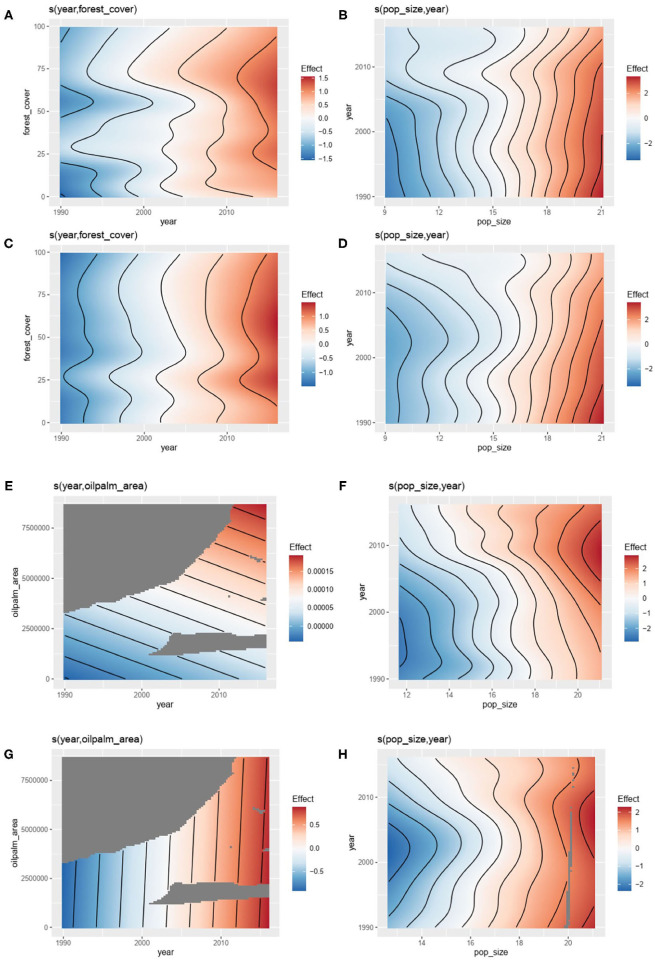
Figure 3.
Results of General additive modeling (GAM) explaining: the number the number of outbreaks of zoonotic diseases with (A) forest cover (controlling for year) and (B) human population size (controlling for year) (see Table 1, model 1); the number the number of outbreaks of vector-borne diseases with (C) forest cover (controlling for year) and (D) human population size (controlling for year) (see Table 1, model 2); the number the number of outbreaks of zoonotic diseases with (E) oil palm area (controlling for year) and (F) human population size (controlling for year) (see Table 1, model 3); the number the number of outbreaks of vector-borne diseases with (G) oil palm area (controlling for year) and (H) human population size (controlling for year) (see Table 1, model 4) (data from GIDEON, FAOSTAT and World Bank).

