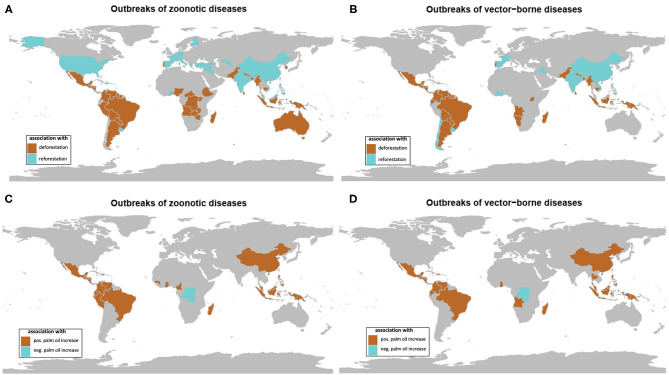
Figure 4.
Maps of significant association between forest cover change (deforestation in brown, reforestation in blue) and (A) outbreaks of zoonotic diseases and (B) outbreaks of vector-borne diseases on temporal trends from 1990 to 2016. Maps of significant association between oil palm area change and (C) outbreaks of zoonotic diseases and (D) outbreaks of vector-borne diseases (positive association in brown, negative association in blue) on temporal trends from 1990 to 2016 (data from GIDEON and FAOSTAT) (see Supplementary File).

