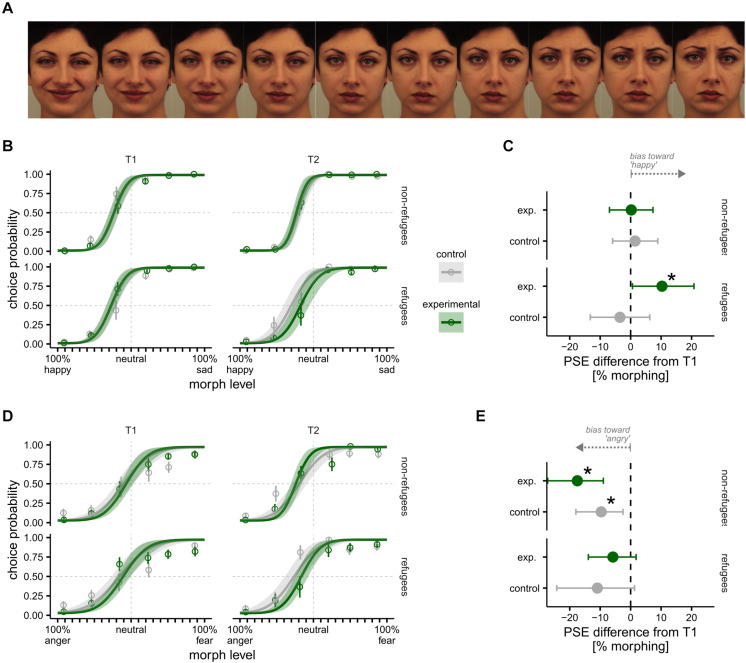
FIGURE 2.
Emotion recognition bias task results between T1 and T2. (A) Example of a subset facial stimuli morphed between happy and sad in steps of 10% from Karolinska Directed Emotional Faces (KDEF); KDEF image ID: AF23HAS, AF23NES, AF23SAS. (B) Happy–sad psychometric functions presented separately for refugee (bottom) and non-refugee (top) children in control and experimental groups at T1 (left) and T2 (right). (C) T2 Difference in happy–sad point of subjective equality (PSE) relative to T1 in refugee (bottom) and non-refugee (top) children in control and experimental groups. (D) Anger–fear bias presented separately for refugee (bottom) and non-refugee (top) children in control and experimental groups at T1 (left) and T2 (right). (E) Difference in anger–fear PSE from T1 to T2 for refugee (bottom) and non-refugee (top) children in control and experimental groups. Asterisk indicates significant difference from T1 to T2. All error bars and bands indicate 95% Bayesian CI.

