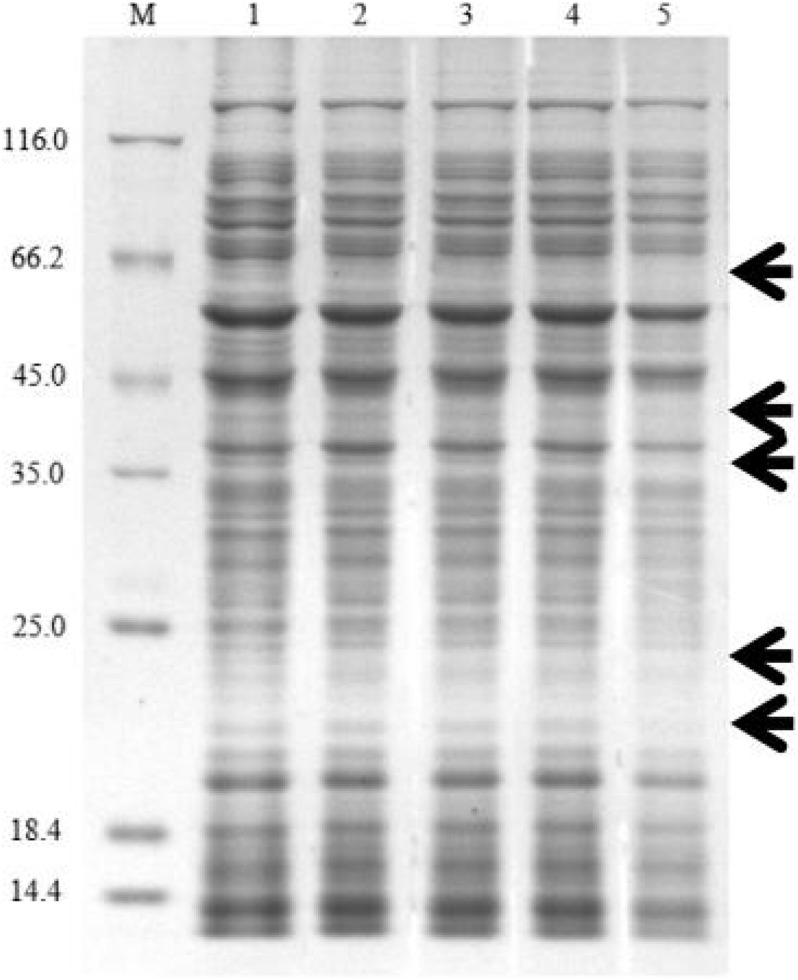
FIGURE 9.
SDS-PAGE analysis of the change of total proteins in Xoo after treating with carbazomycin B for 4 h. Lane 1, PBS treatment as a control; lane 2, 1/2 × MIC carbazomycin B treatment for 4 h; lane 3, 1 × MIC carbazomycin B treatment for 4 h. lane 4, 2 × MIC carbazomycin B treatment for 4 h. lane 5, 4 × MIC carbazomycin B treatment for 4 h. The black arrows indicate lost protein bands.

