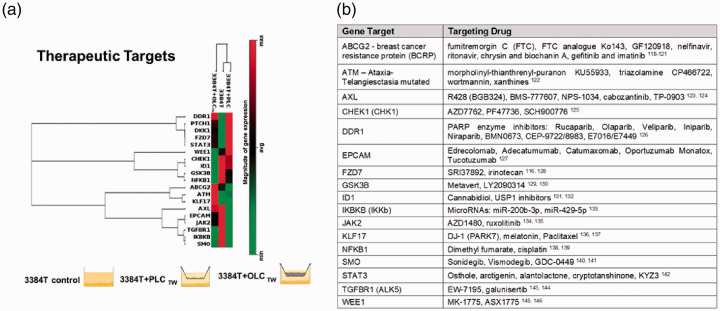
Figure 9.
Transcription profile of genes involved in critical signaling pathways and drug targets. (a) Unsupervised hierarchical clustering of genes shows altered gene expression of cancer therapy drug targets. The three culture conditions (3384T, 3384T + PCLTW, 3384T + OCLTW at day 3) are represented on the top of each cluster (3384 T control n = 2, all others n = 4). (b) Candidate drugs that have been evaluated in pre-clinical to clinical trials which target genes with altered expression in transwell co-cultures or conditioned media conditions. (A color version of this figure is available in the online journal.)

