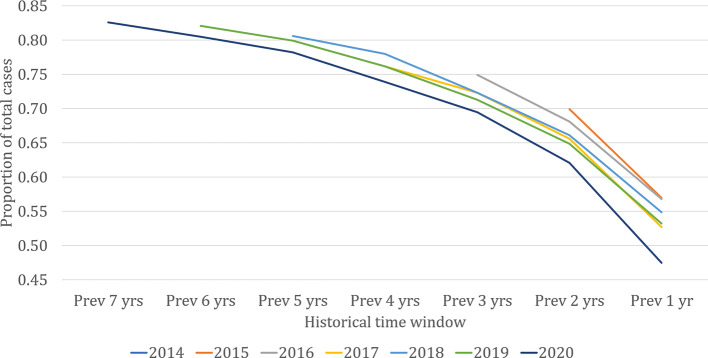
Figure 2.
Proportion of visceral leishmaniasis cases each year coming from previously affected villages, 2013 to 2020 (up to September). The lines represent the cumulative proportion of all cases diagnosed in each of the last seven years that came from villages with cases in the historical time window on the horizontal axis.

