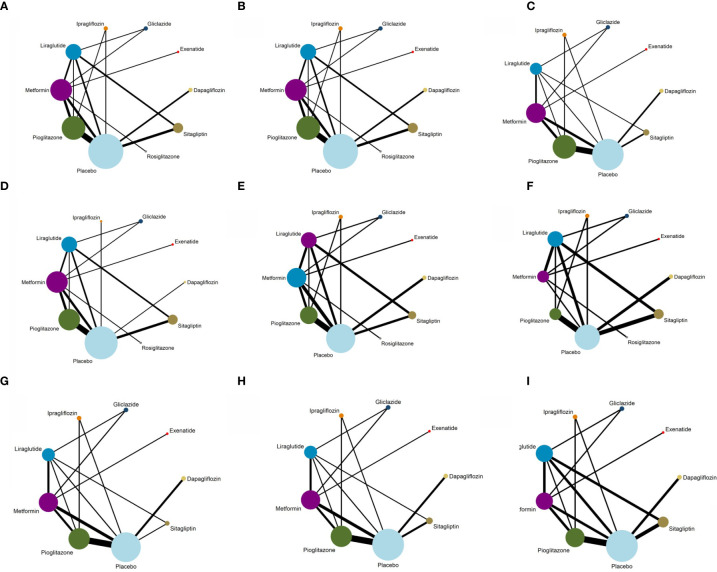
Figure 4.
Evidence structure of different outcome indicators used in the network meta-analysis. (A) Network plot for ALT. (B) Network plot for AST. (C) Network plot for Triglyceride. (D) Network plot for BMI. (E) Network plot for FPG. (F) Network plot for HbA1c. (G) Network plot for HDL. (H) Network plot for LDL. (I) Network plot for Weight.

