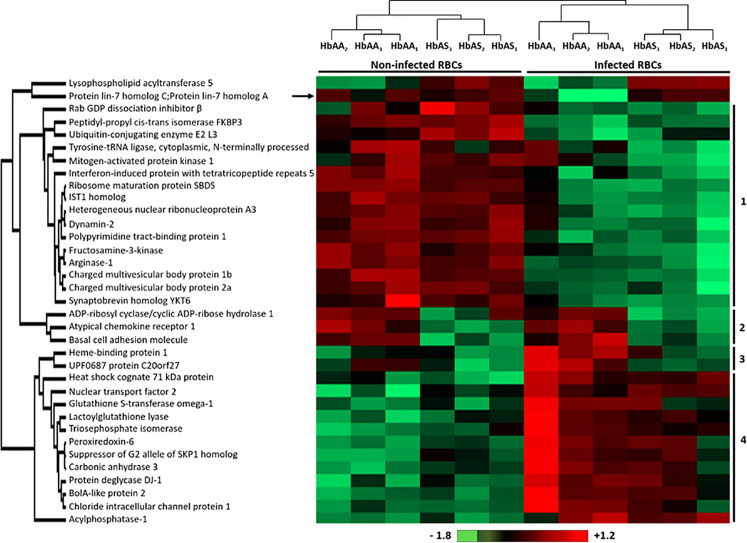
Figure 3.
Differentially detected human erythrocyte proteins as a function of P. falciparum infection and/or HbAS genotype. Six HbAA (non-infected and infected HbAA1, HbAA2, and HbAA3) and six HbAS (non-infected and infected HbAS1, HbAS2, and HbAS3) erythrocyte ghost samples were analyzed by hierarchical clustering based on the detected quantity of RBC proteins (ANOVA test, p-value < 0.05). Samples are displayed horizontally (columns) and proteins are shown vertically (rows). The more the protein is represented in light red, the more it is detected in the corresponding sample, and the more it is colored in light green, the less it is detected. The color bar represents log2 Z score fold-change. Proteins are clustered according to their quantity profile, represented by dendograms. Black arrow: protein profile that cannot be associated with a cluster.

