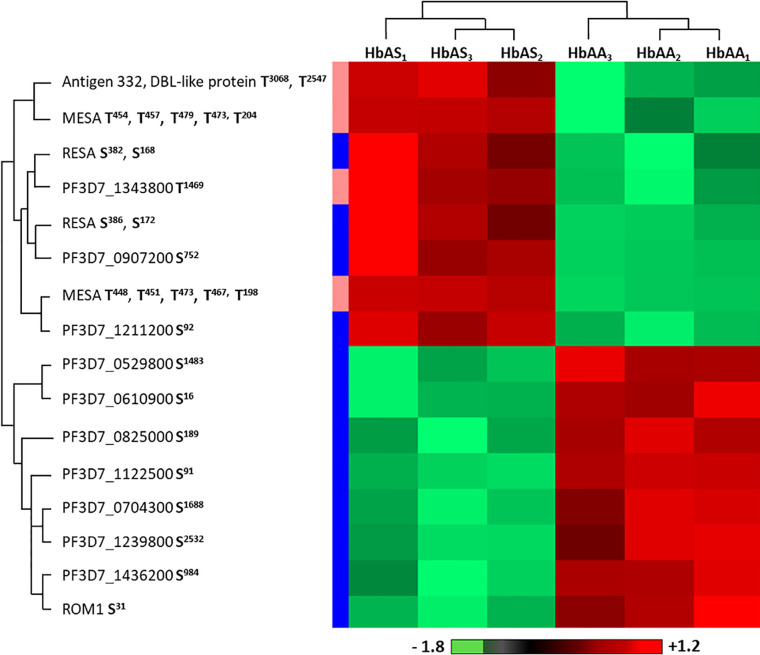
Figure 6.
Differentially phosphorylated sites of parasite proteins according to hemoglobin genotype. Parasites from three HbAA (infected HbAA1, HbAA2, and HbAA3) and three HbAS (infected HbAS1, HbAS2, and HbAS3) extracts were analyzed by hierarchical clustering based on the phosphorylation’s rate of a specific site of RBC proteins (Student’s t-test, p-value < 0.05). Samples are displayed horizontally (columns) and proteins are shown vertically (rows). Phosphosites are specified next to the protein name. The more the site is represented in dark red, the more it is phosphorylated in the corresponding sample, and the more it is colored in light green, the less it is phosphorylated. The color bar represents log2 Z score fold-change. On the left, threonine (T) residues are in pink and serines (S) in blue. Proteins are clustered according to their phosphorylation profile, represented by dendograms.

